mpiP
mpiP is LLNL’s light-weight MPI profiler.
Running the test
The test can be run from the command-line:
module load reframe
cd hpctools.git/reframechecks/mpip/

~/reframe.git/reframe.py \
-C ~/reframe.git/config/cscs.py \
--system daint:gpu \
--prefix=$SCRATCH -r \
-p PrgEnv-gnu \
--performance-report \
--keep-stage-files \
-c ./mpip.py
A successful ReFrame output will look like the following:
Reframe version: 3.0-dev2 (rev: 6d543136)
Launched on host: daint101

[----------] waiting for spawned checks to finish
[       OK ] sphexa_mpiP_sqpatch_024mpi_001omp_100n_3steps on daint:gpu using PrgEnv-gnu
[       OK ] sphexa_mpiP_sqpatch_048mpi_001omp_125n_3steps on daint:gpu using PrgEnv-gnu
[       OK ] sphexa_mpiP_sqpatch_096mpi_001omp_157n_3steps on daint:gpu using PrgEnv-gnu
[----------] all spawned checks have finished

[  PASSED  ] Ran 3 test case(s) from 3 check(s) (0 failure(s))
Looking into the Class shows how
to setup and run the code with the tool. Notice that this class is a derived
class hence super().__init__() is required.
The performance report is generated automatically at the end of the job.
Performance reporting
An overview of the performance data for a job with 3 mpi ranks will typically look like this:
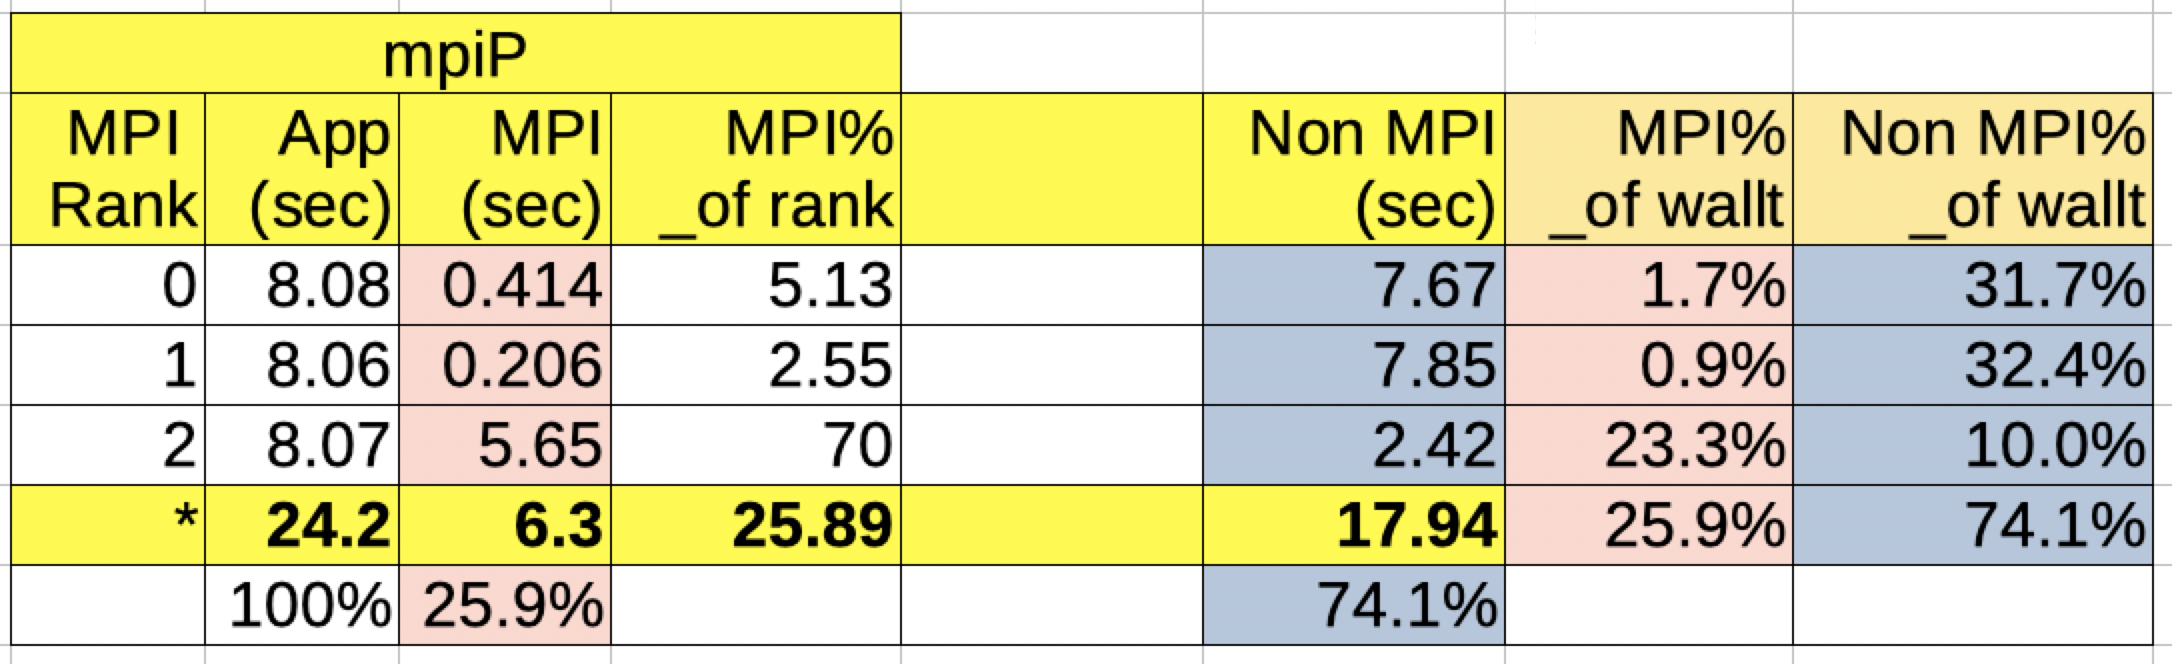
mpiP (overview)
As a result, a typical output from the --performance-report flag will look
like this:
sphexa_mpiP_sqpatch_096mpi_001omp_157n_3steps
   - PrgEnv-gnu
      * num_tasks: 96
      * Elapsed: 16.0431 s
      * _Elapsed: 19 s
      * domain_distribute: 0.3262 s
      * mpi_synchronizeHalos: 0.8793 s
      * BuildTree: 0 s
      * FindNeighbors: 1.557 s
      * Density: 1.5117 s
      * EquationOfState: 0.0132 s
      * IAD: 3.6159 s
      * MomentumEnergyIAD: 5.2786 s
      * Timestep: 2.5658 s
      * UpdateQuantities: 0.0202 s
      * EnergyConservation: 0.0092 s
      * SmoothingLength: 0.0131 s
      * %MomentumEnergyIAD: 32.9 %
      * %Timestep: 15.99 %
      * %mpi_synchronizeHalos: 5.48 %
      * %FindNeighbors: 9.71 %
      * %IAD: 22.54 %
      * mpip_avg_app_time: 16.88 s
      * mpip_avg_mpi_time: 3.59 s
      * %mpip_avg_mpi_time: 21.27 %
      * %mpip_avg_mpi_time_max: 95.86 %
      * %mpip_avg_mpi_time_min: 15.75 %
      * %mpip_avg_non_mpi_time: 78.73 %
This report is generated from the data collected from the tool and processed in
the set_mpip_perf_patterns method of
the MpipBaseTest class.
This tool outputs text performance report files only.