VI-HPS tools
The VI-HPS Institute (Virtual Institute for High Productivity Supercomputing) provides tools that can assist developers of simulation codes to address their needs in performance analysis:
Score-P is a highly scalable instrumentation and measurement infrastructure for profiling, event tracing, and online analysis. It supports a wide range of HPC platforms and programming models. Score-P provides core measurement services for a range of specialized analysis tools, such as Vampir, Scalasca and others.
Scalasca supports the performance optimization of parallel programs with a collection of scalable trace-based tools for in-depth analyses of concurrent behavior. The analysis identifies potential performance bottlenecks - in particular those concerning communication and synchronization - and offers guidance in exploring their causes.
Vampir is a performance visualizer that allows to quickly study the program runtime behavior at a fine level of details. This includes the display of detailed performance event recordings over time in timelines and aggregated profiles. Interactive navigation and zooming are the key features of the tool, which help to quickly identify inefficient or faulty parts of a program.
- For further information, please check:
Score-P
Profiling
Running the test
The test can be run from the command-line:
module load reframe
cd hpctools.git/reframechecks/scorep/

~/reframe.git/reframe.py \
-C ~/reframe.git/config/cscs.py \
--system daint:gpu \
--prefix=$SCRATCH -r \
-p PrgEnv-gnu \
--performance-report \
--keep-stage-files \
-c ./scorep_sampling_profiling.py
A successful ReFrame output will look like the following:
Reframe version: 2.22
Launched on host: daint101

[----------] started processing sphexa_scorepS+P_sqpatch_024mpi_001omp_100n_10steps_1000000cycles (Tool validation)
[ RUN      ] sphexa_scorepS+P_sqpatch_024mpi_001omp_100n_10steps_1000000cycles on daint:gpu using PrgEnv-gnu
[       OK ] sphexa_scorepS+P_sqpatch_024mpi_001omp_100n_10steps_1000000cycles on daint:gpu using PrgEnv-gnu
[----------] finished processing sphexa_scorepS+P_sqpatch_024mpi_001omp_100n_10steps_1000000cycles (Tool validation)

[  PASSED  ] Ran 1 test case(s) from 1 check(s) (0 failure(s))
Looking into the Class shows how to setup and run
the code with the tool.
Set self.build_system.cxx to instrument the code and set the SCOREP runtime
variables with self.variables to trigger the (sampling based) profiling
analysis. Use self.post_run to generate the tool’s report.
Performance reporting
A typical output from the --performance-report flag will look like this:
PERFORMANCE REPORT
------------------------------------------------------------------------------
sphexa_scorepS+P_sqpatch_024mpi_001omp_100n_0steps_1000000cycles
- daint:gpu
   - PrgEnv-gnu
      * num_tasks: 24
      * Elapsed: 3.8245 s
      * _Elapsed: 6 s
      * domain_distribute: 0.1039 s
      * mpi_synchronizeHalos: 0.4705 s
      * BuildTree: 0 s
      * FindNeighbors: 0.384 s
      * Density: 0.3126 s
      * EquationOfState: 0.0047 s
      * IAD: 0.6437 s
      * MomentumEnergyIAD: 1.1131 s
      * Timestep: 0.6459 s
      * UpdateQuantities: 0.0078 s
      * EnergyConservation: 0.0024 s
      * SmoothingLength: 0.0052 s
      * %MomentumEnergyIAD: 29.1 %
      * %Timestep: 16.89 %
      * %mpi_synchronizeHalos: 12.3 %
      * %FindNeighbors: 10.04 %
      * %IAD: 16.83 %
      * scorep_elapsed: 4.8408 s
      * %scorep_USR: 66.1 %
      * %scorep_MPI: 21.9 %
      * scorep_top1: 24.2 % (void sphexa::sph::computeMomentumAndEnergyIADImpl)
      * %scorep_Energy_exclusive: 24.216 %
      * %scorep_Energy_inclusive: 24.216 %
This report is generated from the data collected from the tool and processed in
the self.perf_patterns part of the Class.
For example, the information about the top1 function is extracted with the
scorep_top1_pct method.
Looking at the report with the tool gives more insight into the performance of
the code:
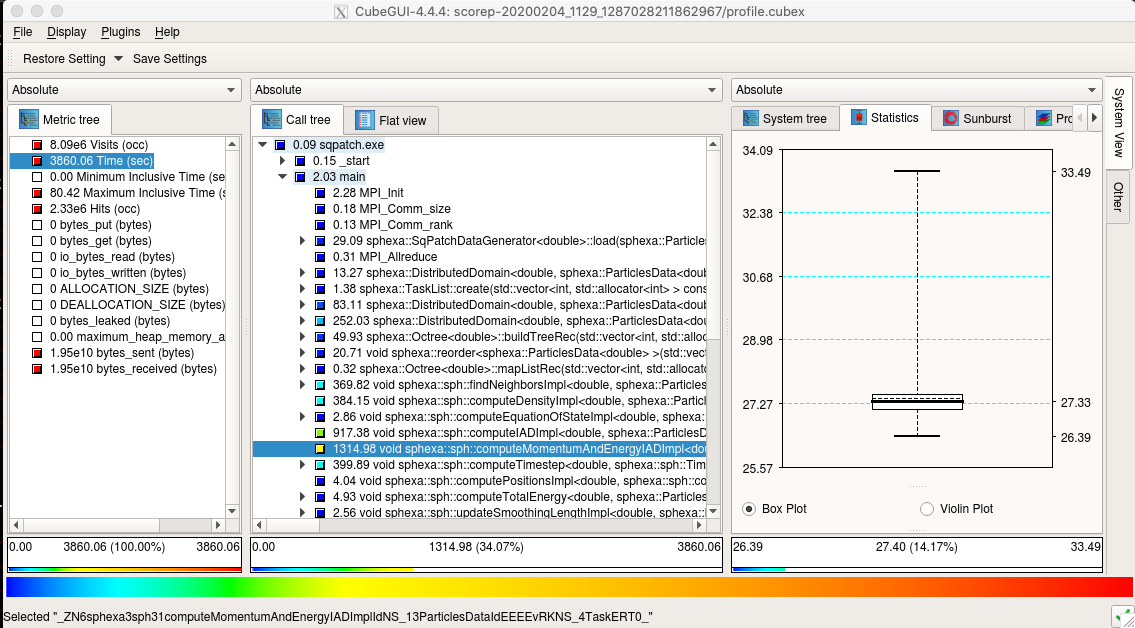
Score-P Cube (launched with: cube scorep-/profile.cubex)
Tracing
Running the test
The test can be run from the command-line:
module load reframe
cd hpctools.git/reframechecks/scorep/

~/reframe.git/reframe.py \
-C ~/reframe.git/config/cscs.py \
--system daint:gpu \
--prefix=$SCRATCH -r \
-p PrgEnv-gnu \
--performance-report \
--keep-stage-files \
-c ./scorep_sampling_tracing.py
A successful ReFrame output will look like the following:
Reframe version: 2.22
Launched on host: daint101

[----------] started processing sphexa_scorepS+T_sqpatch_024mpi_001omp_100n_10steps_1000000cycles (Tool validation)
[ RUN      ] sphexa_scorepS+T_sqpatch_024mpi_001omp_100n_10steps_1000000cycles on daint:gpu using PrgEnv-gnu
[       OK ] sphexa_scorepS+T_sqpatch_024mpi_001omp_100n_10steps_1000000cycles on daint:gpu using PrgEnv-gnu
[----------] finished processing sphexa_scorepS+T_sqpatch_024mpi_001omp_100n_10steps_1000000cycles (Tool validation)

[  PASSED  ] Ran 1 test case(s) from 1 check(s) (0 failure(s))
Looking into the Class shows how to setup and run
the code with the tool.
Set self.build_system.cxx to instrument the code and set the SCOREP runtime
variables with self.variables to trigger the (sampling based) tracing
analysis.
Performance reporting
A typical output from the --performance-report flag will look like this:
PERFORMANCE REPORT
------------------------------------------------------------------------------
sphexa_scorepS+T_sqpatch_024mpi_001omp_100n_4steps_5000000cycles
- dom:gpu
   - PrgEnv-gnu
      * num_tasks: 24
      * Elapsed: 20.5236 s
      * _Elapsed: 27 s
      * domain_distribute: 0.4484 s
      * mpi_synchronizeHalos: 2.4355 s
      * BuildTree: 0 s
      * FindNeighbors: 1.875 s
      * Density: 1.8138 s
      * EquationOfState: 0.019 s
      * IAD: 3.7302 s
      * MomentumEnergyIAD: 6.1363 s
      * Timestep: 3.5853 s
      * UpdateQuantities: 0.0272 s
      * EnergyConservation: 0.0087 s
      * SmoothingLength: 0.0232 s
      * %MomentumEnergyIAD: 29.9 %
      * %Timestep: 17.47 %
      * %mpi_synchronizeHalos: 11.87 %
      * %FindNeighbors: 9.14 %
      * %IAD: 18.18 %
      * max_ipc_rk0: 1.297827 ins/cyc
      * max_rumaxrss_rk0: 127448 kilobytes
This report is generated from the data collected from the tool and processed in
the self.perf_patterns part of the Class.
For example, the information about the ipc for rank 0 is extracted with the
ipc_rk0 method.
Looking at the report with the tool gives more insight into the performance of
the code:
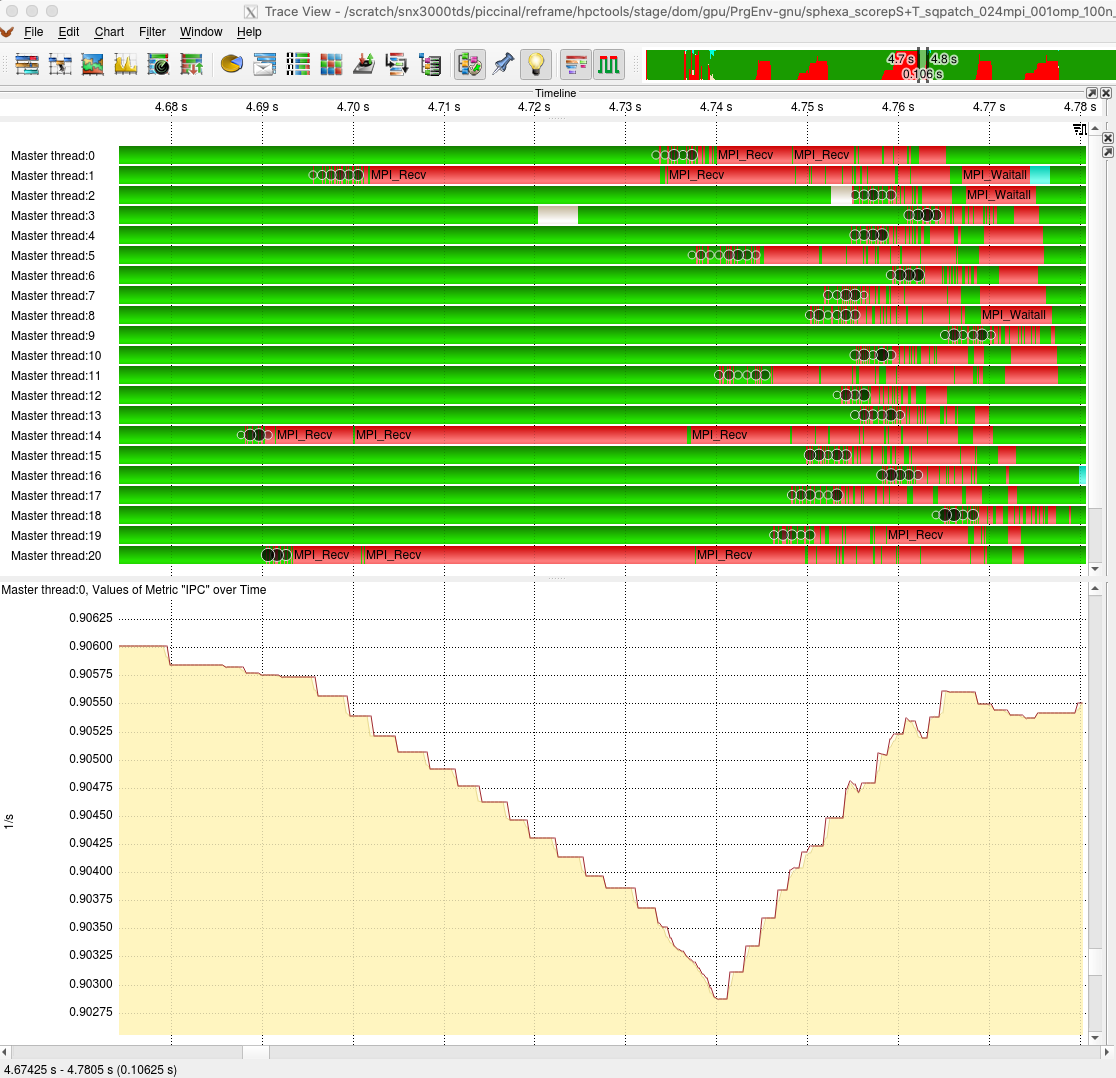
Score-P Vampir (launched with: vampir scorep-/traces.otf2)
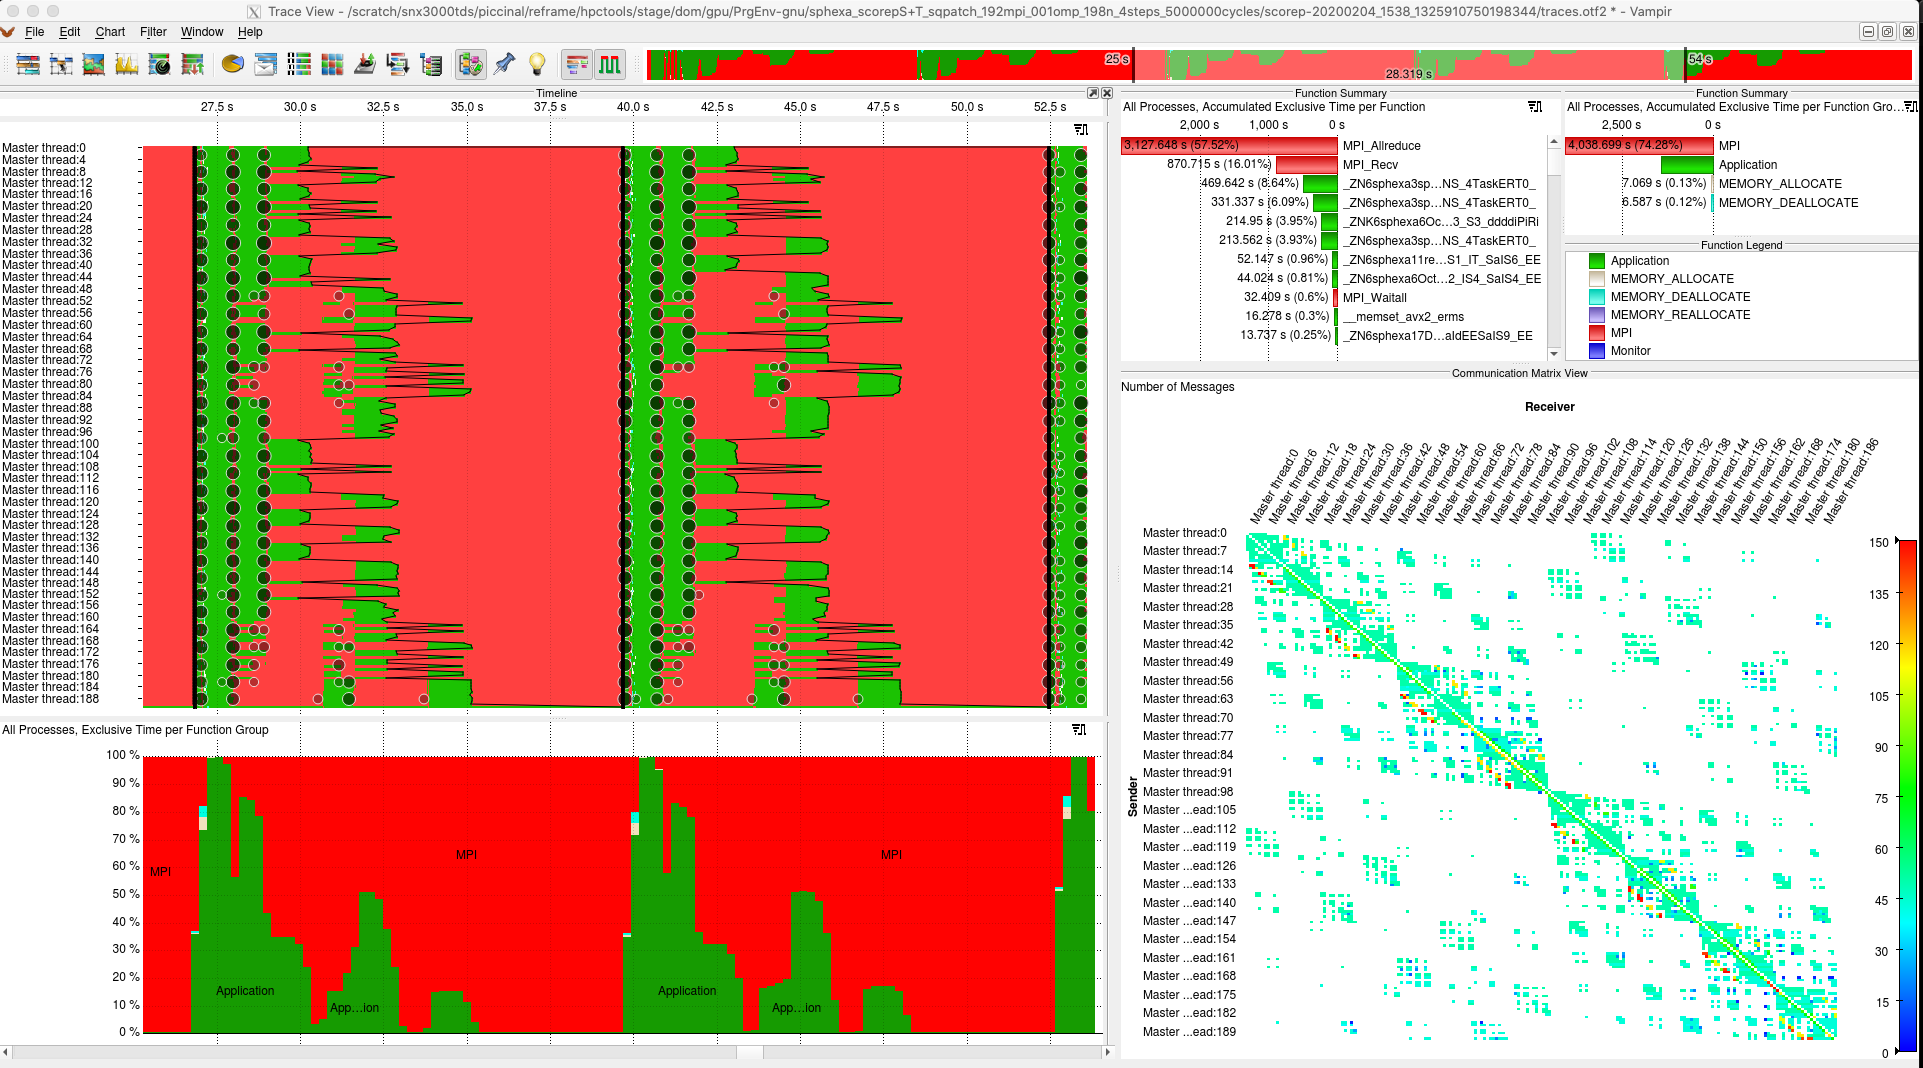
Score-P Vampir (communication matrix)
Scalasca
Profiling
Running the test
The test can be run from the command-line:
module load reframe
cd hpctools.git/reframechecks/scalasca

~/reframe.git/reframe.py \
-C ~/reframe.git/config/cscs.py \
--system daint:gpu \
--prefix=$SCRATCH -r \
-p PrgEnv-gnu \
--performance-report \
--keep-stage-files \
-c ./scalasca_sampling_profiling.py
A successful ReFrame output will look like the following:
Reframe version: 2.22
Launched on host: daint101

[----------] started processing sphexa_scalascaS+P_sqpatch_024mpi_001omp_100n_10steps_1000000cycles (Tool validation)
[ RUN      ] sphexa_scalascaS+P_sqpatch_024mpi_001omp_100n_10steps_1000000cycles on daint:gpu using PrgEnv-gnu
[       OK ] sphexa_scalascaS+P_sqpatch_024mpi_001omp_100n_10steps_1000000cycles on daint:gpu using PrgEnv-gnu
[----------] finished processing sphexa_scalascaS+P_sqpatch_024mpi_001omp_100n_10steps_1000000cycles (Tool validation)

[  PASSED  ] Ran 1 test case(s) from 1 check(s) (0 failure(s))
Looking into the Class shows how to setup and
run the code with the tool.
Set self.build_system.cxx to instrument the code and set the SCOREP runtime
variables with self.variables to trigger the (sampling based) profiling
analysis. Use self.post_run to generate the tool’s report.
Performance reporting
A typical output from the --performance-report flag will look like this:
PERFORMANCE REPORT
------------------------------------------------------------------------------
sphexa_scalascaS+P_sqpatch_024mpi_001omp_100n_4steps_5000000cycles
- dom:gpu
   - PrgEnv-gnu
      * num_tasks: 24
      * Elapsed: 20.4549 s
      * _Elapsed: 38 s
      * domain_distribute: 0.4089 s
      * mpi_synchronizeHalos: 2.4644 s
      * BuildTree: 0 s
      * FindNeighbors: 1.8787 s
      * Density: 1.8009 s
      * EquationOfState: 0.0174 s
      * IAD: 3.726 s
      * MomentumEnergyIAD: 6.1141 s
      * Timestep: 3.5887 s
      * UpdateQuantities: 0.0424 s
      * EnergyConservation: 0.0177 s
      * SmoothingLength: 0.017 s
      * %MomentumEnergyIAD: 29.89 %
      * %Timestep: 17.54 %
      * %mpi_synchronizeHalos: 12.05 %
      * %FindNeighbors: 9.18 %
      * %IAD: 18.22 %
      * scorep_elapsed: 21.4262 s
      * %scorep_USR: 71.0 %
      * %scorep_MPI: 23.3 %
      * scorep_top1: 30.1 % (void sphexa::sph::computeMomentumAndEnergyIADImpl)
      * %scorep_Energy_exclusive: 30.112 %
      * %scorep_Energy_inclusive: 30.112 %
This report is generated from the data collected from the tool and processed in
the self.perf_patterns part of the Class.
For example, the information about the top1 function is extracted with the
scorep_top1_pct method.
Notice that the same sanity functions used with Score-P can be used with
Scalasca too. Looking at the report with the tool gives more insight into the
performance of the code:
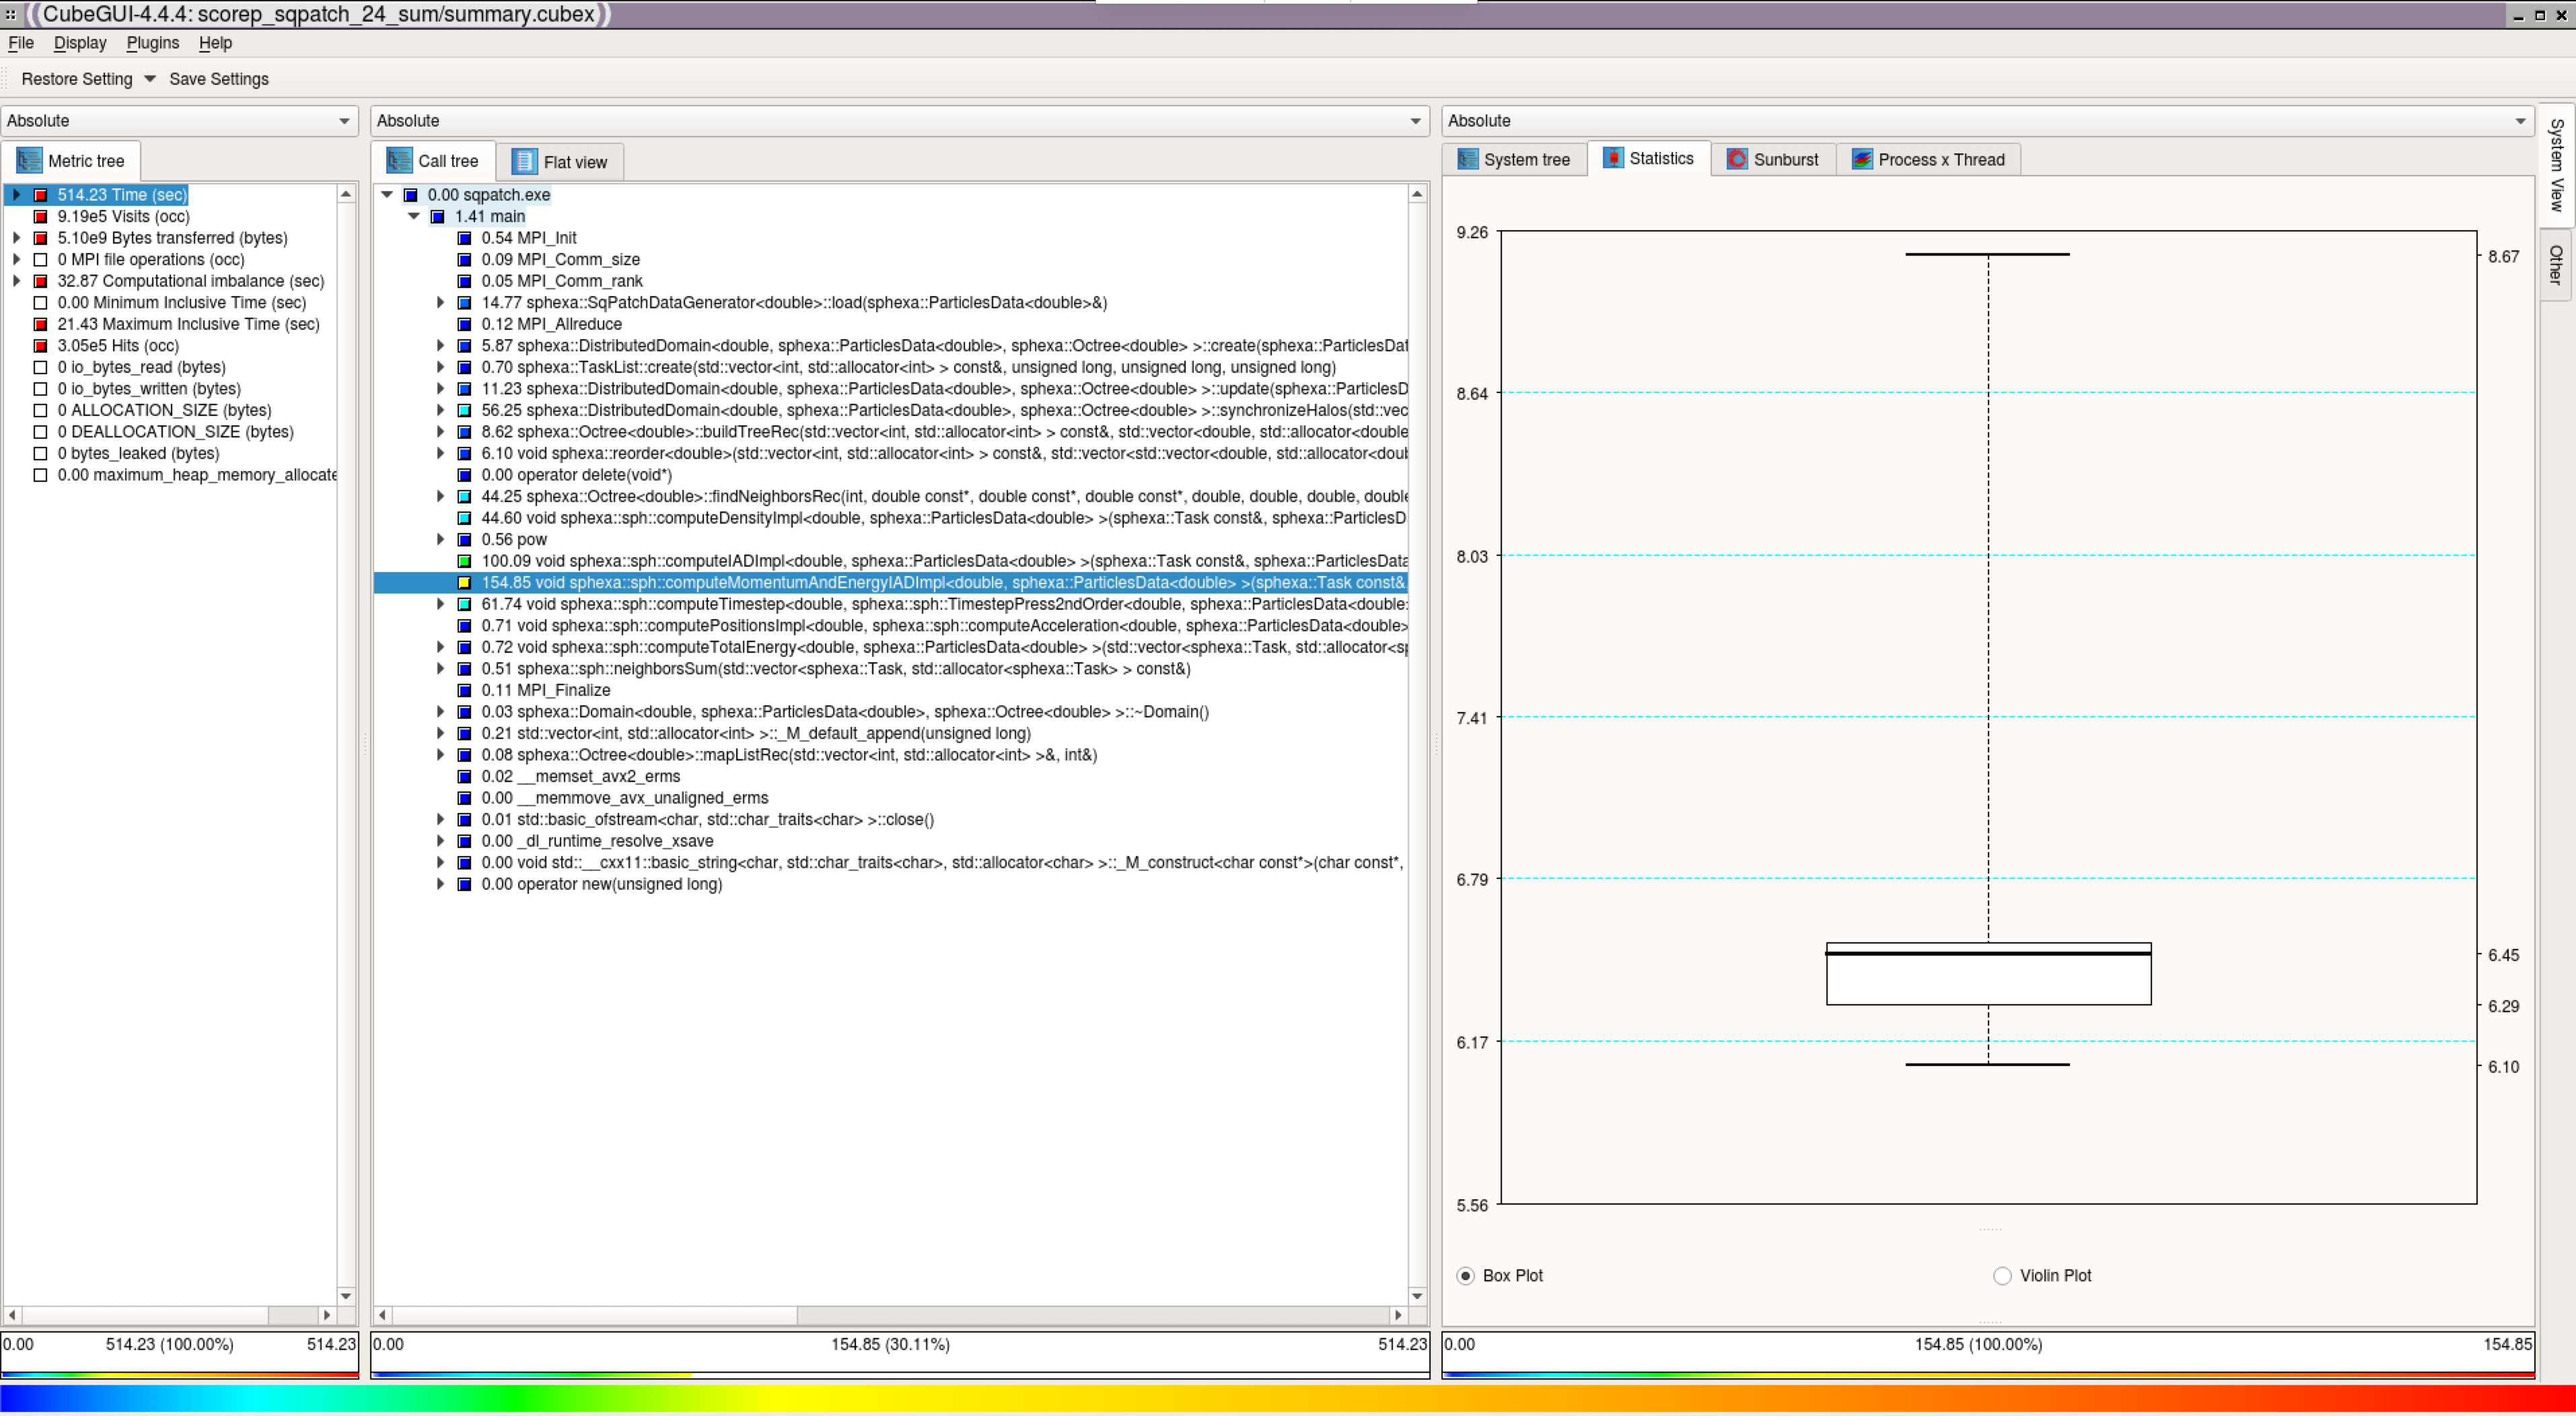
Scalasca Cube (launched with: cube scorep_sqpatch_24_sum/profile.cubex)
Tracing
Running the test
The test can be run from the command-line:
module load reframe
cd hpctools.git/reframechecks/scalasca

~/reframe.git/reframe.py \
-C ~/reframe.git/config/cscs.py \
--system daint:gpu \
--prefix=$SCRATCH -r \
-p PrgEnv-gnu \
--performance-report \
--keep-stage-files \
-c ./scalasca_sampling_tracing.py
A successful ReFrame output will look like the following:
Reframe version: 2.22
Launched on host: daint101

[----------] started processing sphexa_scalascaS+T_sqpatch_024mpi_001omp_100n_10steps_1000000cycles (Tool validation)
[ RUN      ] sphexa_scalascaS+T_sqpatch_024mpi_001omp_100n_10steps_1000000cycles on daint:gpu using PrgEnv-gnu
[       OK ] sphexa_scalascaS+T_sqpatch_024mpi_001omp_100n_10steps_1000000cycles on daint:gpu using PrgEnv-gnu
[----------] finished processing sphexa_scalascaS+T_sqpatch_024mpi_001omp_100n_10steps_1000000cycles (Tool validation)

[  PASSED  ] Ran 1 test case(s) from 1 check(s) (0 failure(s))
Looking into the Class shows how to setup and
run the code with the tool.
Set self.build_system.cxx to instrument the code and set the SCOREP runtime
variables with self.variables to trigger the (sampling based) tracing
analysis. Use self.post_run to generate the tool’s report.
Performance reporting
A typical output from the --performance-report flag will look like this:
PERFORMANCE REPORT
------------------------------------------------------------------------------
sphexa_scalascaS+T_sqpatch_024mpi_001omp_100n_4steps_5000000cycles
- dom:gpu
   - PrgEnv-gnu
      * num_tasks: 24
      * Elapsed: 20.5242 s
      * _Elapsed: 28 s
      * domain_distribute: 0.4712 s
      * mpi_synchronizeHalos: 2.4623 s
      * BuildTree: 0 s
      * FindNeighbors: 1.8752 s
      * Density: 1.8066 s
      * EquationOfState: 0.0174 s
      * IAD: 3.7259 s
      * MomentumEnergyIAD: 6.1355 s
      * Timestep: 3.572 s
      * UpdateQuantities: 0.0273 s
      * EnergyConservation: 0.0079 s
      * SmoothingLength: 0.017 s
      * %MomentumEnergyIAD: 29.89 %
      * %Timestep: 17.4 %
      * %mpi_synchronizeHalos: 12.0 %
      * %FindNeighbors: 9.14 %
      * %IAD: 18.15 %
      * mpi_latesender: 2090 count
      * mpi_latesender_wo: 19 count
      * mpi_latereceiver: 336 count
      * mpi_wait_nxn: 1977 count
      * max_ipc_rk0: 1.294516 ins/cyc
      * max_rumaxrss_rk0: 127932 kilobytes
This report is generated from the data collected from the tool and processed in
the self.perf_patterns part of the Class.
For example, the information about the numer of MPI Late Sender is extracted
with the rpt_trace_stats_d method
(latesender). Cube help describes this metric as the time lost waiting caused
by a blocking receive operation (e.g., MPI_Recv or MPI_Wait) that is posted
earlier than the corresponding send operation. Looking at the report with the
tools (Cube and Vampir) gives more insight into the performance of the code:
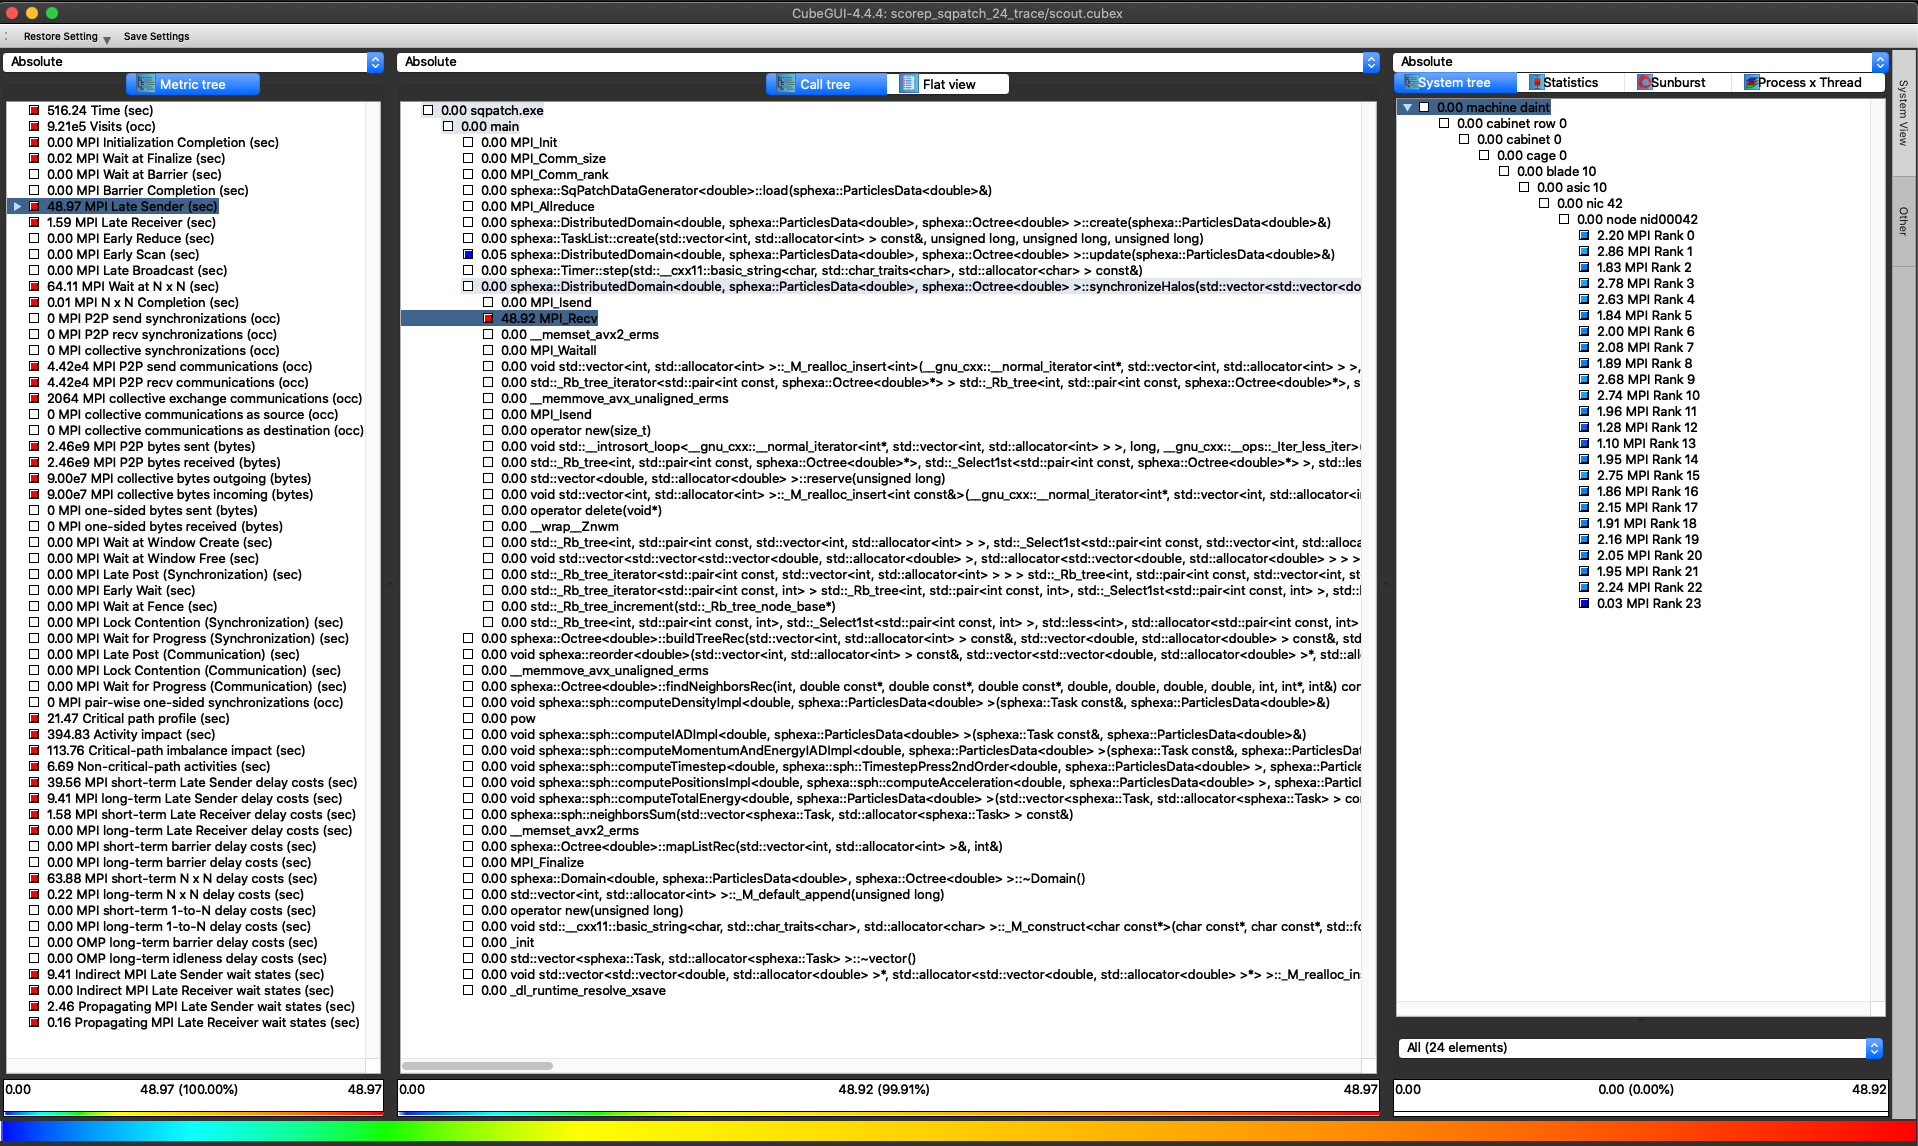
Scalasca Cube (launched with: cube scorep_sqpatch_24_trace/scout.cubex)
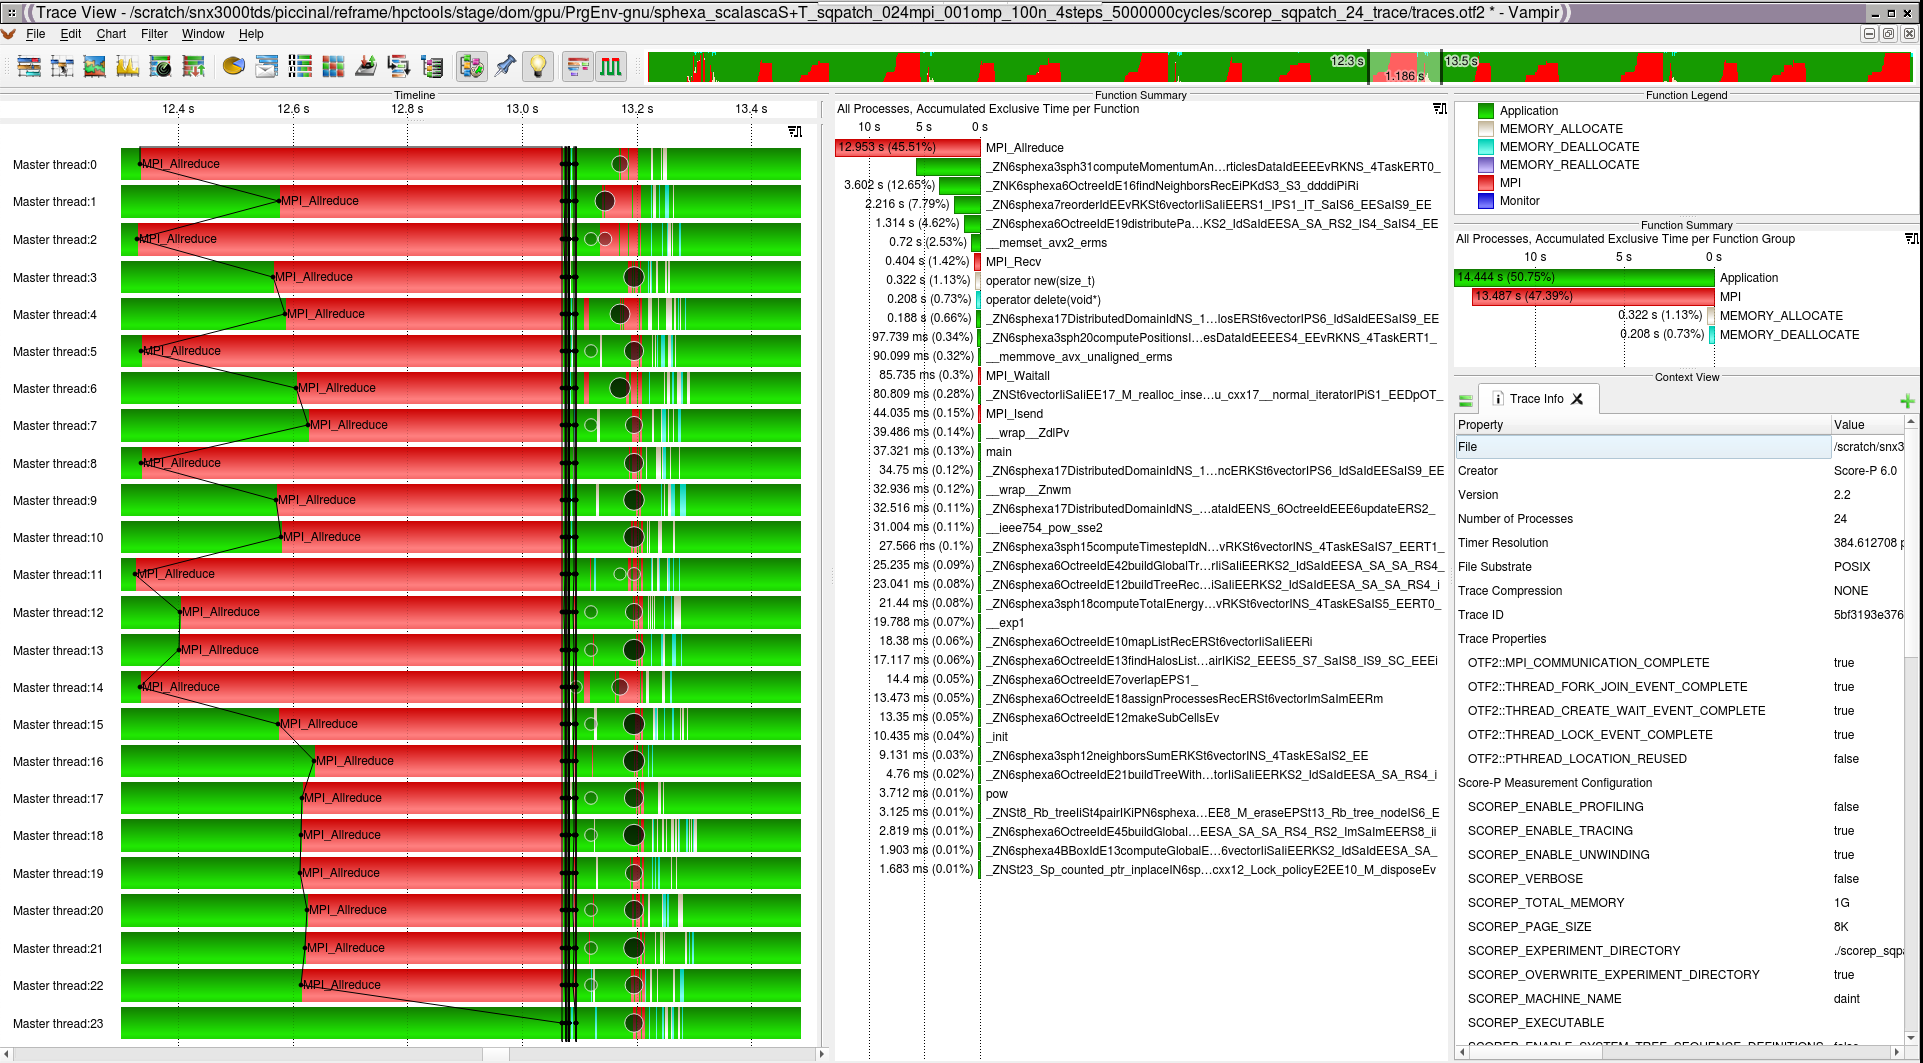
Scalasca Vampir (launched with: vampir scorep_sqpatch_24_trace/traces.otf2)