CrayPAT
CrayPAT (Cray Performance Measurement and Analysis toolset) is Cray’s performance analysis tool.
CrayPAT provides detailed information about application performance. It can be used for profiling, tracing and hardware performance counter based analysis. It also provides access to a wide variety of performance experiments that measure how an executable program consumes resources while it is running, as well as several different user interfaces that provide access to the experiment and reporting functions.
- CrayPAT consists of the following main components
pat_run - a simplified, easy-to-use version of CrayPAT for dynamically-linked executables,
perftools-lite - an easy-to-use version of CrayPAT,
perftools - CrayPAT, for advanced users:
pat_build - used to instrument the program to be analyzed,
pat_report - a standalone text report generator that can be use to further explore the data generated by instrumented program execution,
Apprentice2 - a graphical analysis tool that can be used, in addition to pat_report to further explore and visualize the data generated by instrumented program execution.
Reveal - Reveal helps to identify top time consuming loops, with compiler feedback on dependency and vectorization.
pat_view - a graphical analysis tool that can be used to view CrayPat data. pat_view takes as input several ap2 data sets and creates either a graph or the raw data of the scaling information for the input data.
pat_run
Running the test
The test can be run from the command-line:
module load reframe
cd hpctools.git/reframechecks/perftools/

~/reframe.git/reframe.py \
-C ~/reframe.git/config/cscs.py \
--system daint:gpu \
--prefix=$SCRATCH -r \
-p PrgEnv-gnu \
--performance-report \
--keep-stage-files \
-c ./patrun.py
A successful ReFrame output will look like the following:
Reframe version: 3.0-dev2 (rev: 6d543136)
Launched on host: daint101

[----------] waiting for spawned checks to finish
[       OK ] sphexa_patrun_sqpatch_024mpi_001omp_100n_4steps on daint:gpu using PrgEnv-gnu
[       OK ] sphexa_patrun_sqpatch_048mpi_001omp_125n_4steps on daint:gpu using PrgEnv-gnu
[       OK ] sphexa_patrun_sqpatch_096mpi_001omp_157n_4steps on daint:gpu using PrgEnv-gnu
[----------] all spawned checks have finished

[  PASSED  ] Ran 3 test case(s) from 3 check(s) (0 failure(s))
Looking into the Class shows how to setup and run
the code with the tool. Notice that this class is a derived class hence
super().__init__() is required.
The performance report is generated automatically at the end of the job.
Performance reporting
An overview of the performance data for a job with 96 mpi ranks will typically look like this:
Table 10:  Wall Clock Time, Memory High Water Mark

   Process |   Process | PE=[mmm]
      Time |     HiMem |
           | (MiBytes) |

 18.744450 |      76.8 | Total
|--------------------------------
| 18.755150 |      60.1 | pe.12
| 18.744323 |      99.6 | pe.20
| 18.721262 |      53.8 | pe.93
|================================
Table 1:  Profile by Function

  Samp% |    Samp |    Imb. |  Imb. | Group
        |         |    Samp | Samp% |  Function
        |         |         |       |   PE=HIDE

 100.0% | 1,858.4 |      -- |    -- | Total
|-----------------------------------------------------------------------------
|  84.5% | 1,570.2 |      -- |    -- | USER
||----------------------------------------------------------------------------
||  34.7% |   645.1 |    40.9 |  6.0% | sphexa::sph::computeMomentumAndEnergyIADImpl<>
||  23.8% |   442.9 |    26.1 |  5.6% | sphexa::sph::computeIADImpl<>
||  10.7% |   198.1 |    14.9 |  7.1% | sphexa::Octree<>::findNeighborsRec
||  10.3% |   191.0 |    12.0 |  6.0% | sphexa::sph::computeDensityImpl<>
||   1.5% |    28.2 |    16.8 | 37.8% | sphexa::reorder<>
||   1.1% |    20.2 |     8.8 | 30.6% | sphexa::Octree<>::buildTreeRec
||   1.1% |    19.9 |    11.1 | 36.2% | main
||============================================================================
|  11.1% |   205.9 |      -- |    -- | MPI
||----------------------------------------------------------------------------
||   6.6% |   122.2 | 1,664.8 | 94.1% | MPI_Allreduce
||   3.5% |    64.7 |   676.3 | 92.2% | MPI_Recv
||============================================================================
|   4.2% |    78.3 |      -- |    -- | ETC
||----------------------------------------------------------------------------
||   2.2% |    40.7 |     9.3 | 18.8% | __sin_avx
||   1.1% |    19.9 |    14.1 | 42.0% | __memset_avx2_erms

Table 8:  Program energy and power usage (from Cray PM)

   Node |     Node |   Process | Node Id
 Energy |    Power |      Time |  PE=HIDE
    (J) |      (W) |           |

 13,096 |  698.660 | 18.744450 | Total
As a result, a typical output from the --performance-report flag will look
like this:
      * patrun_wallt_max: 18.7552 s
      * patrun_wallt_avg: 18.7445 s
      * patrun_wallt_min: 18.7213 s
      * patrun_mem_max: 60.1 MiBytes
      * patrun_mem_min: 53.8 MiBytes
      * patrun_memory_traffic_global: 53.95 GB
      * patrun_memory_traffic_local: 53.95 GB
      * %patrun_memory_traffic_peak: 4.2 %
      * patrun_memory_traffic: 2.15 GB
      * patrun_ipc: 0.64
      * %patrun_stallcycles: 58.0 %
      * %patrun_user: 84.7 % (slow: 1677.0 smp [pe14] / mean:1570.2 median:1630.0 / fast:26.0 [pe95])
      * %patrun_mpi: 11.1 % (slow: 1793.0 smp [pe94] / mean:205.9 median:146.0 / fast:91.0 [pe56])
      * %patrun_etc: 4.2 % (slow: 97.0 smp [pe63] / mean:78.3 median:78.5 / fast:38.0 [pe93])
      * %patrun_total: 100.0 % (slow: 1862.0 smp [pe92] / mean:1854.4 median:1854.0 / fast:1835.0 [pe5])
      * %patrun_user_slowest: 90.5 % (pe.14)
      * %patrun_mpi_slowest: 5.6 % (pe.14)
      * %patrun_etc_slowest: 3.9 % (pe.14)
      * %patrun_user_fastest: 1.4 % (pe.95)
      * %patrun_mpi_fastest: 96.3 % (pe.95)
      * %patrun_etc_fastest: 2.3 % (pe.95)
      * %patrun_avg_usr_reported: 84.5 %
      * %patrun_avg_mpi_reported: 11.1 %
      * %patrun_avg_etc_reported: 4.4 %
      * %patrun_hotspot1: 34.7 % (sphexa::sph::computeMomentumAndEnergyIADImpl<>)
      * %patrun_mpi_h1: 6.6 % (MPI_Allreduce)
      * %patrun_mpi_h1_imb: 94.1 % (MPI_Allreduce)
      * patrun_avg_energy: 3274.0 J
      * patrun_avg_power: 174.665 W
This report is generated from the performance data collected from the tool and processed in
the patrun_walltime_and_memory
and set_tool_perf_patterns
methods of the SphExaPatRunCheck class.
Looking at the report with the tool gives more insight into the performance of the code:
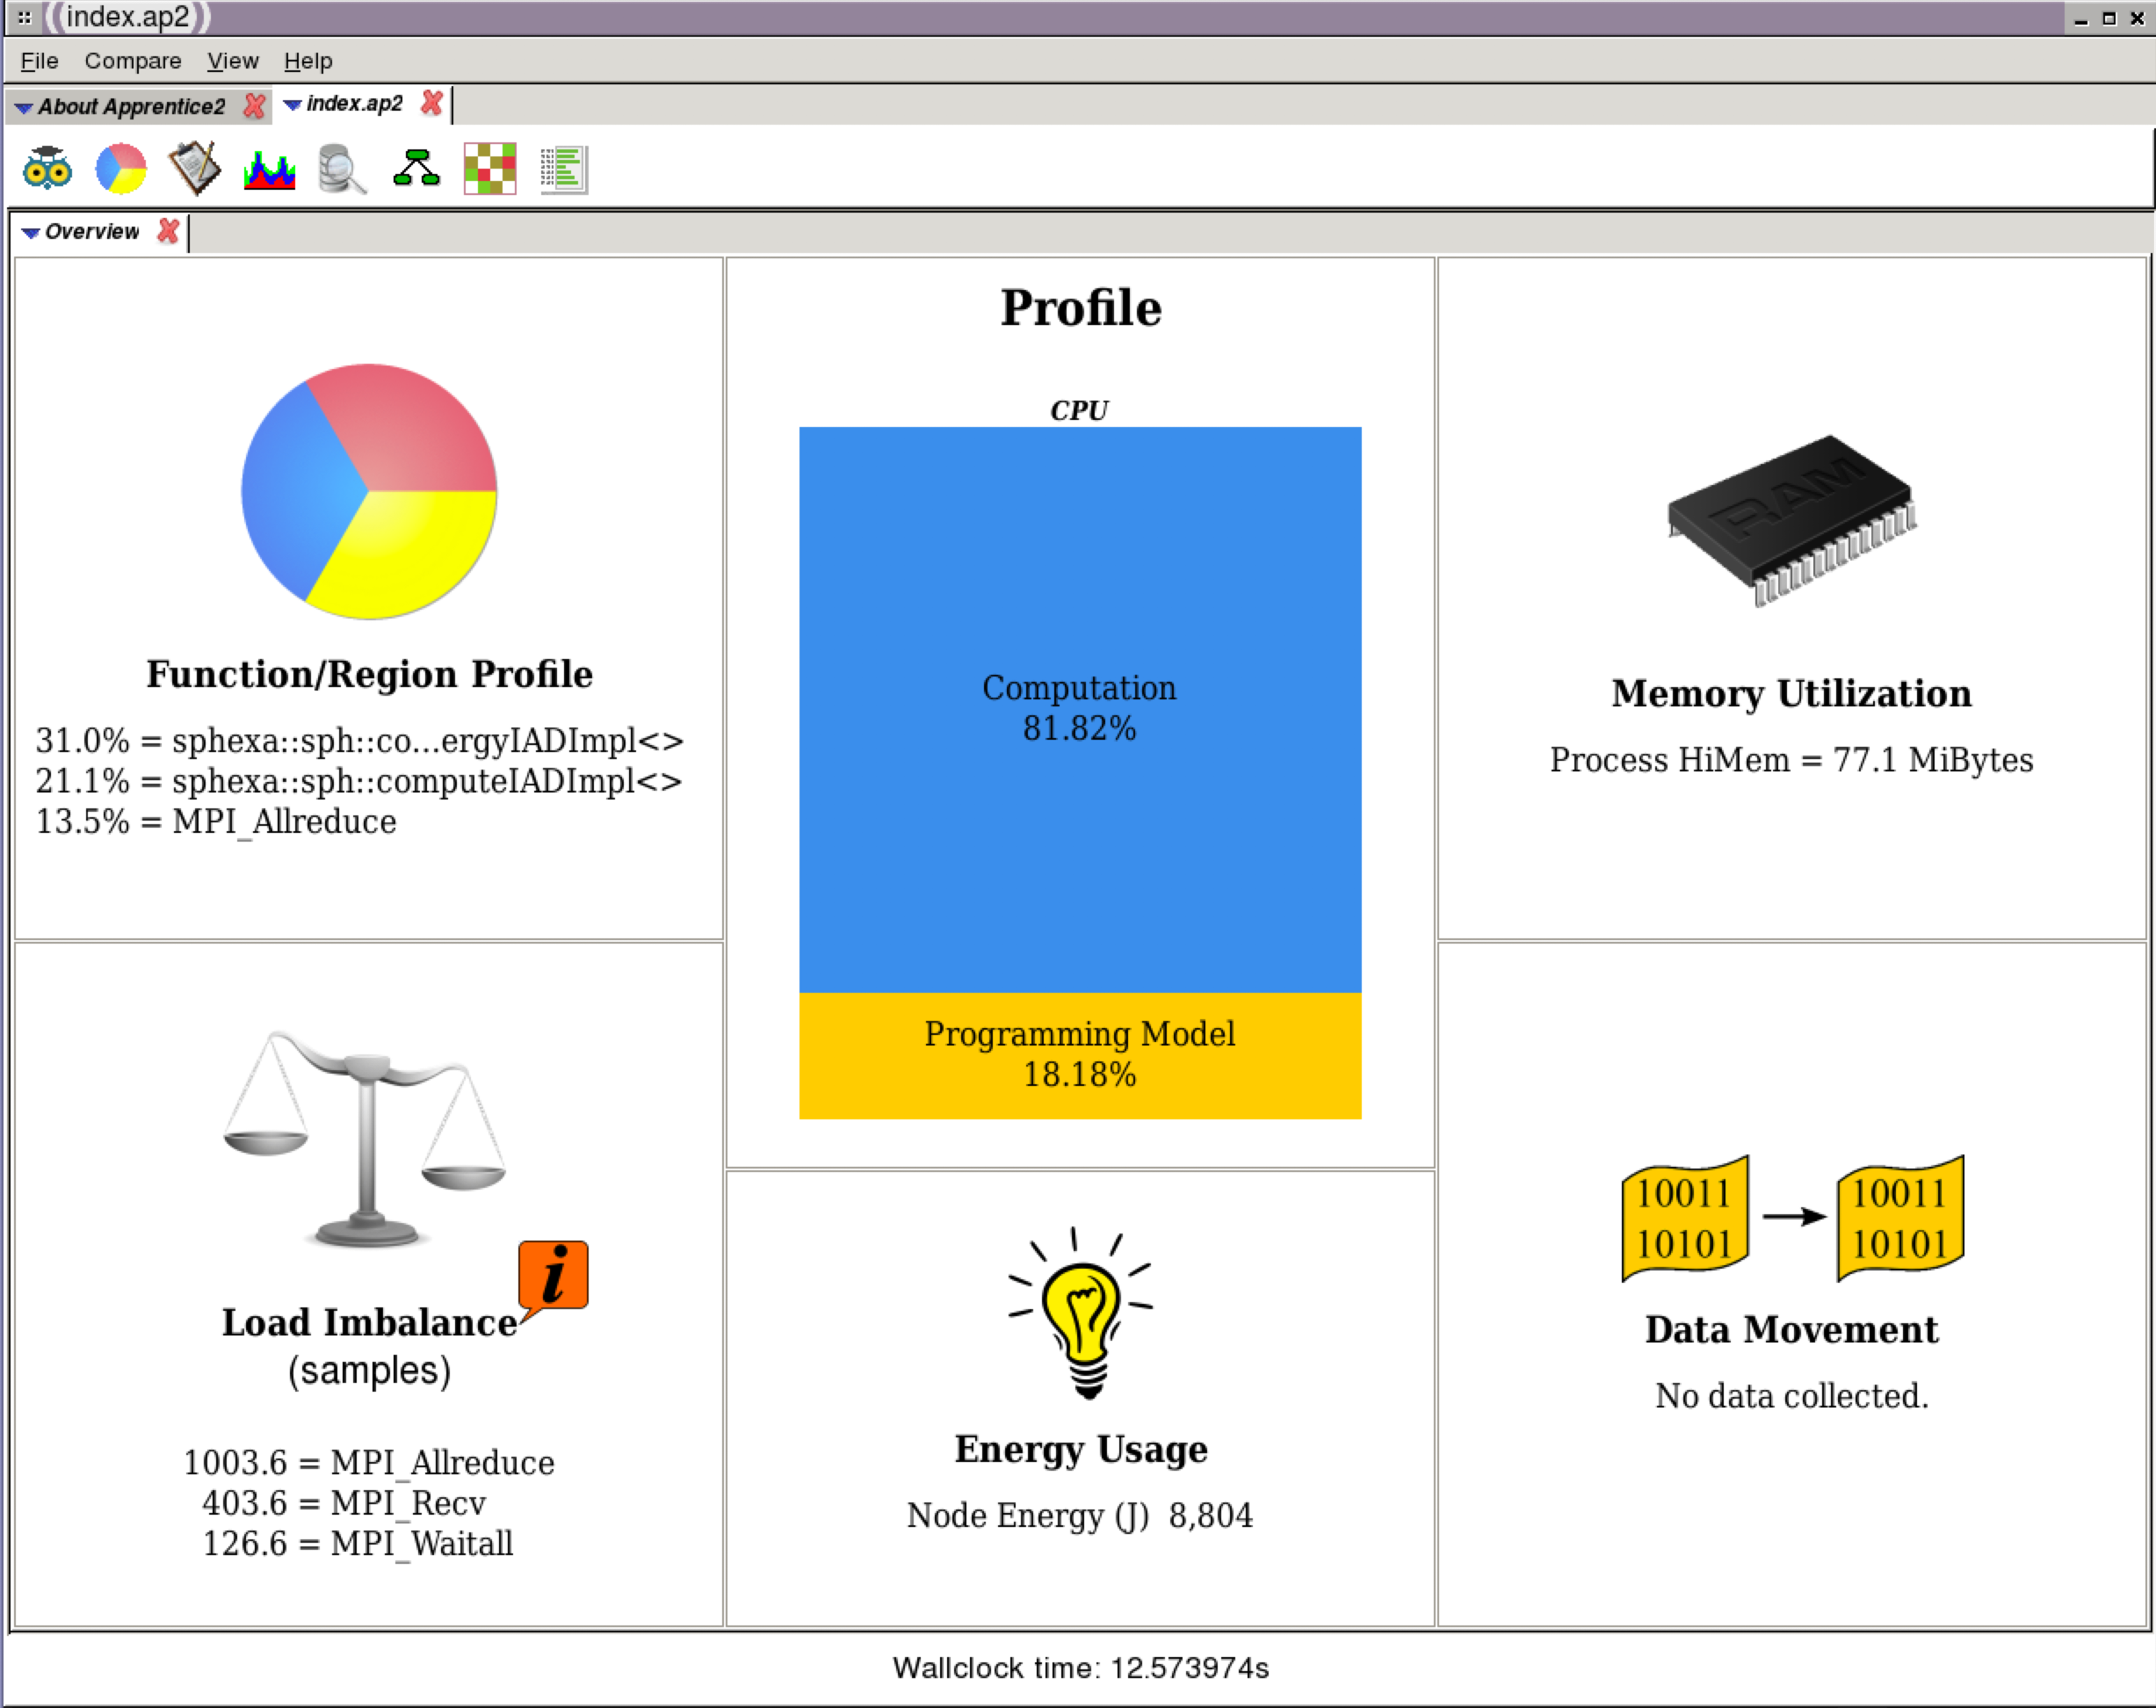
Apprentice2 (launched with app2 sqpatch.exe+15597-5s/index.ap2)
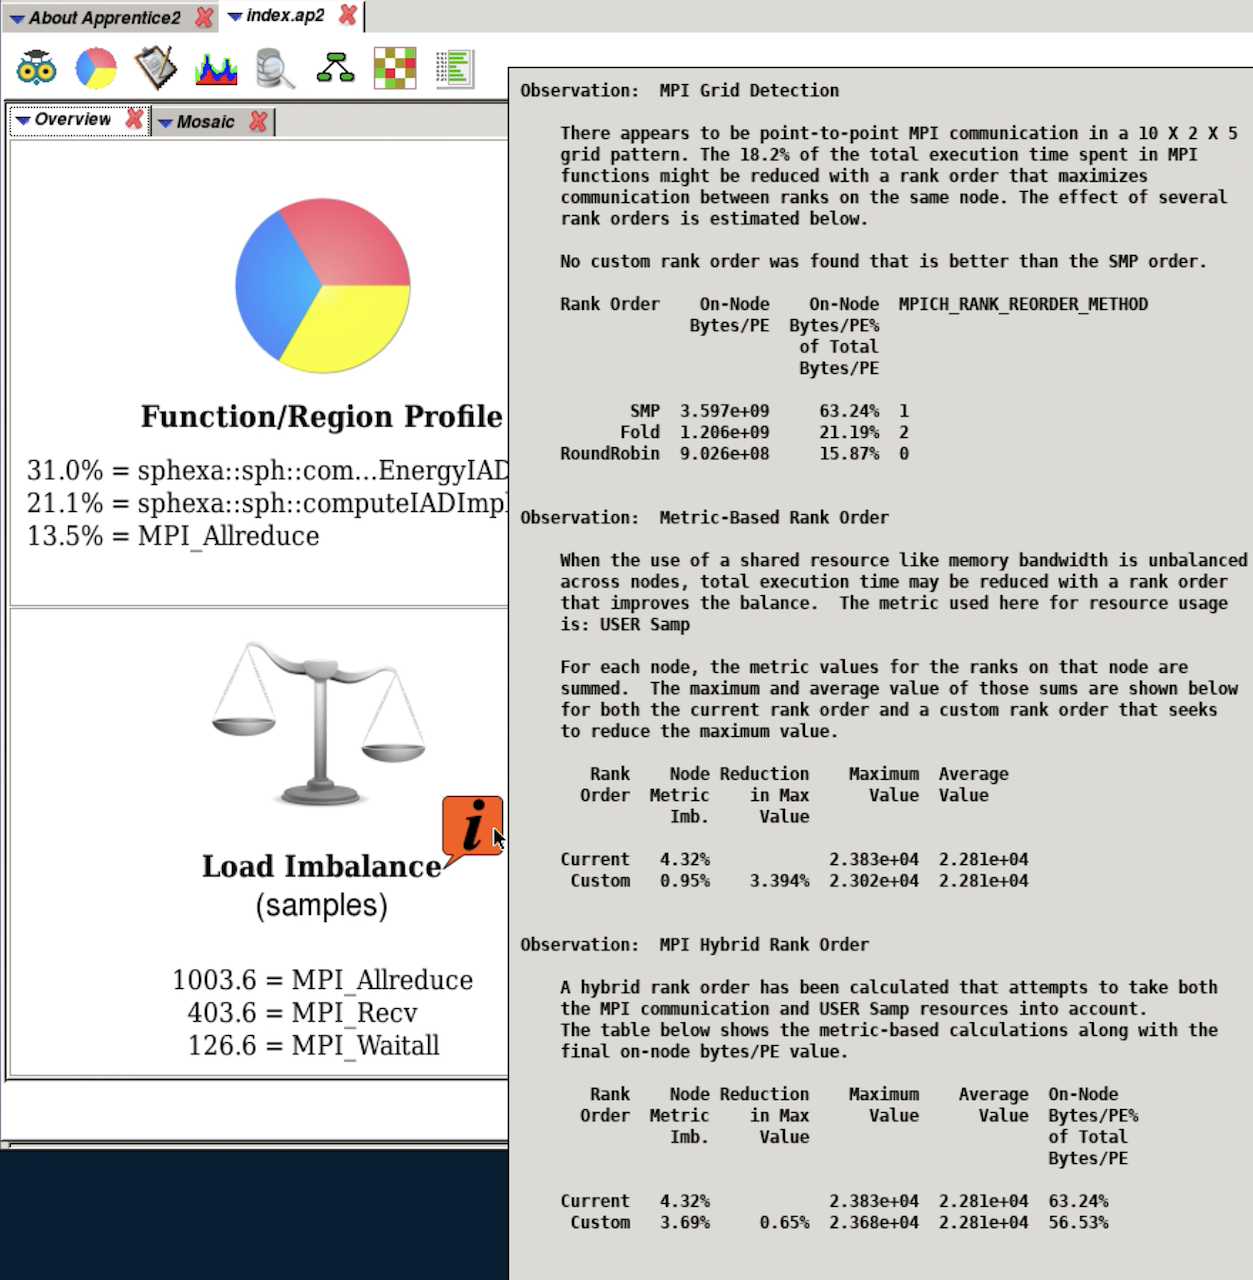
Apprentice2 (overview: load imbalance)
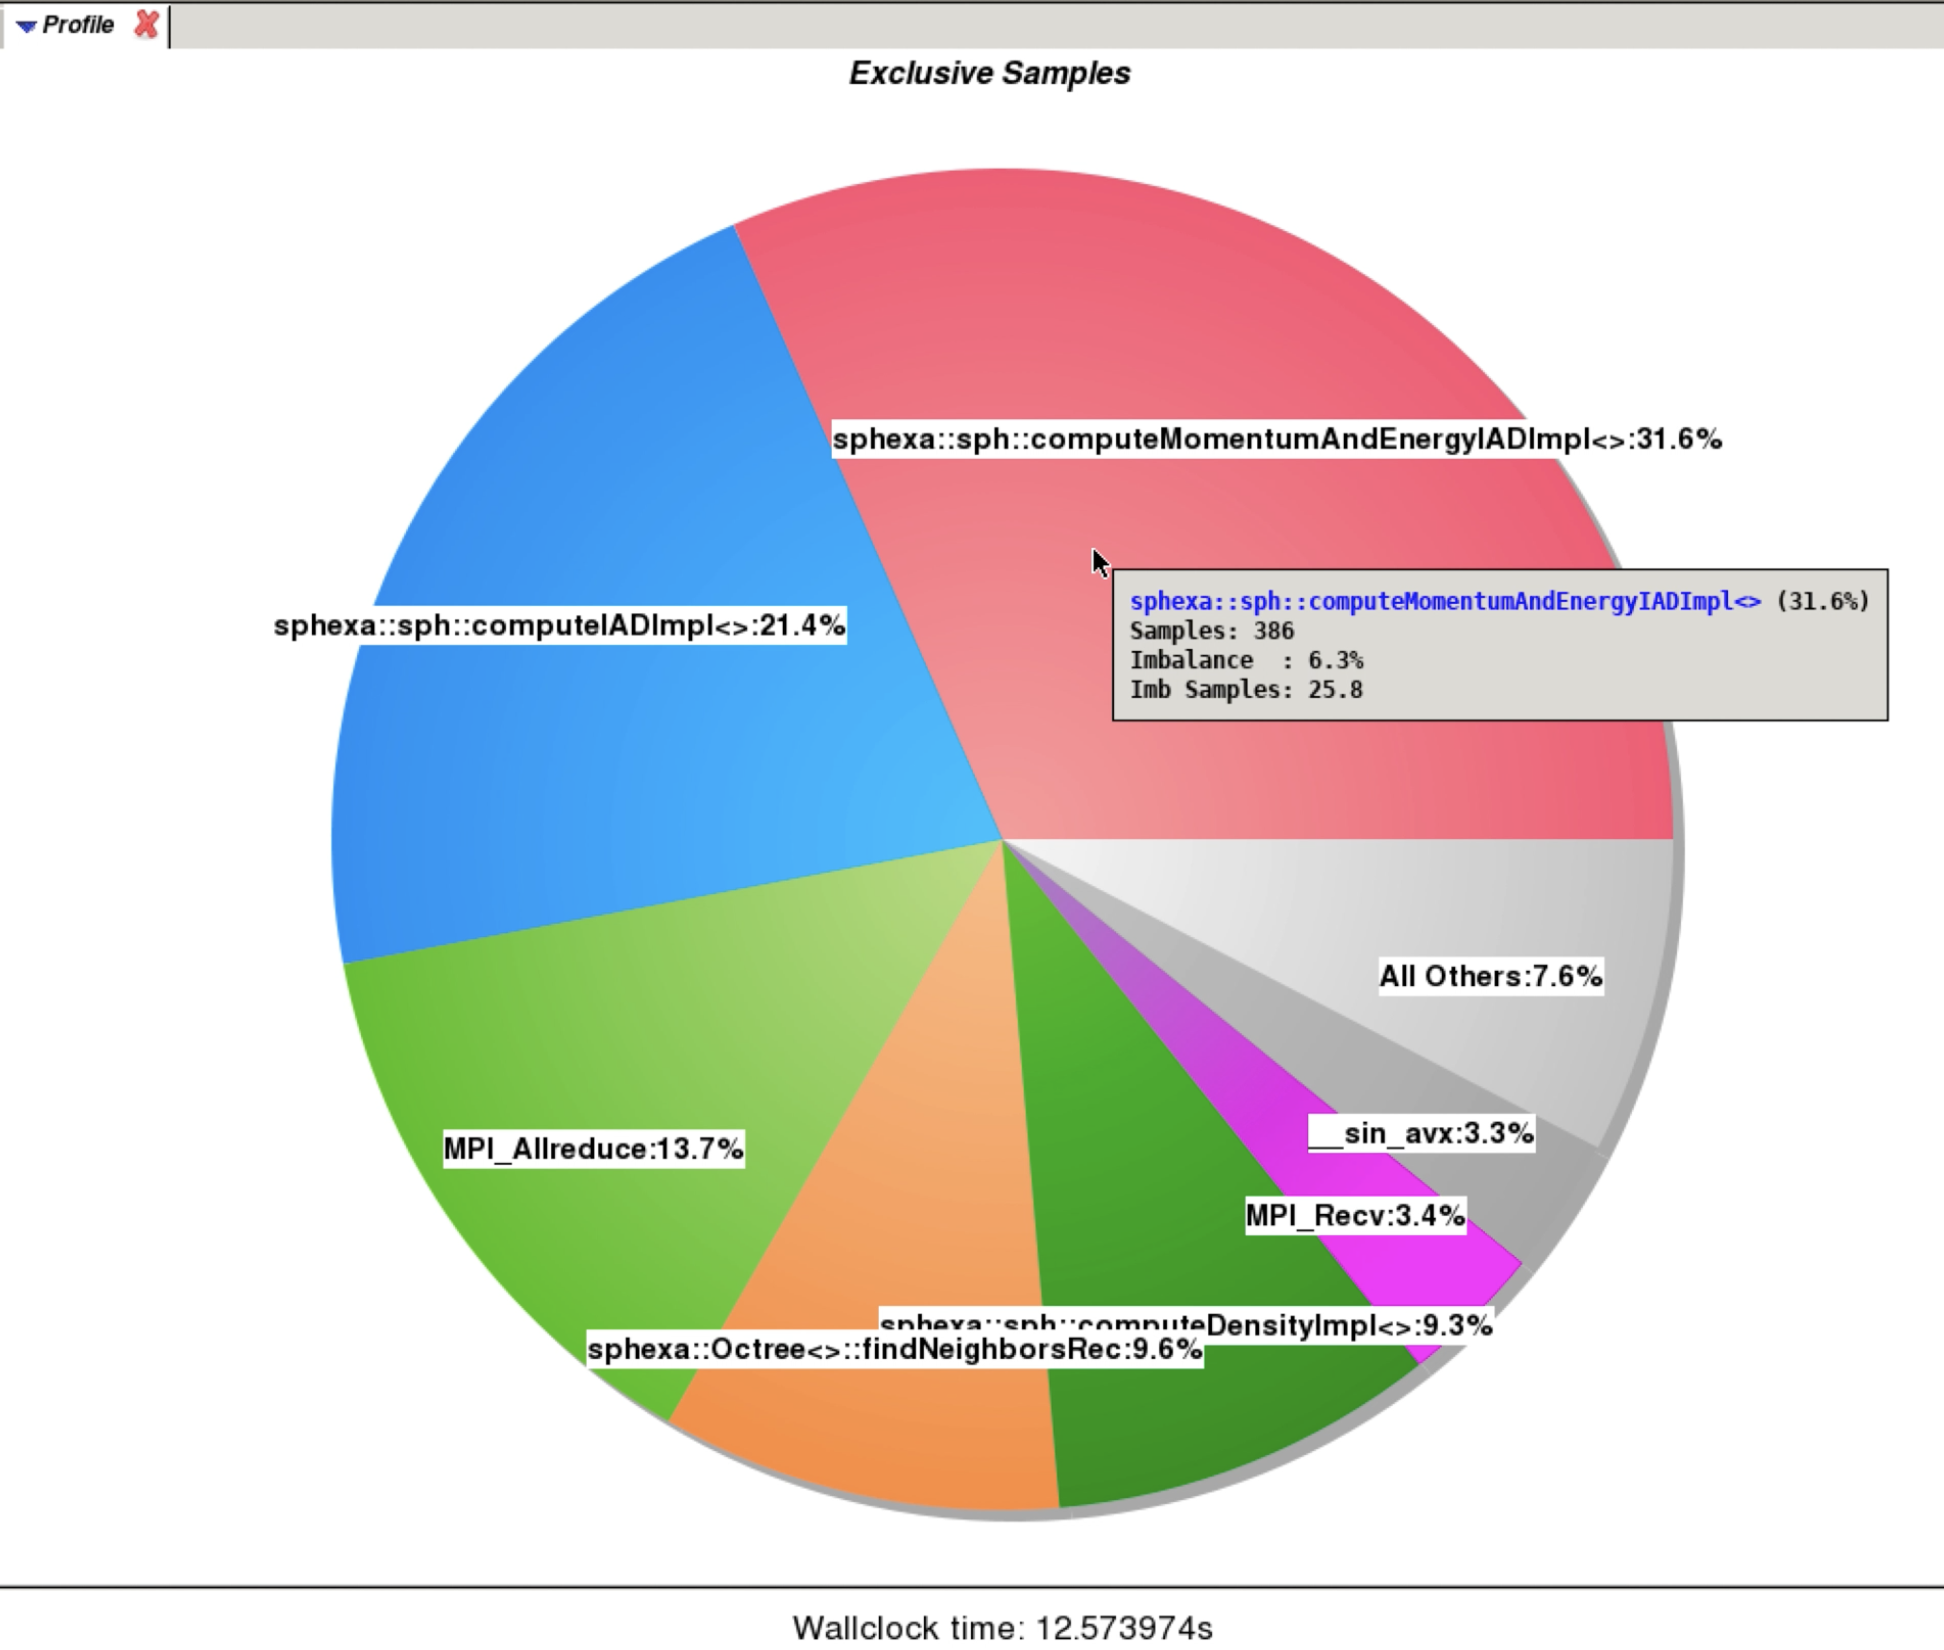
Apprentice2 (overview: exclusive samples)
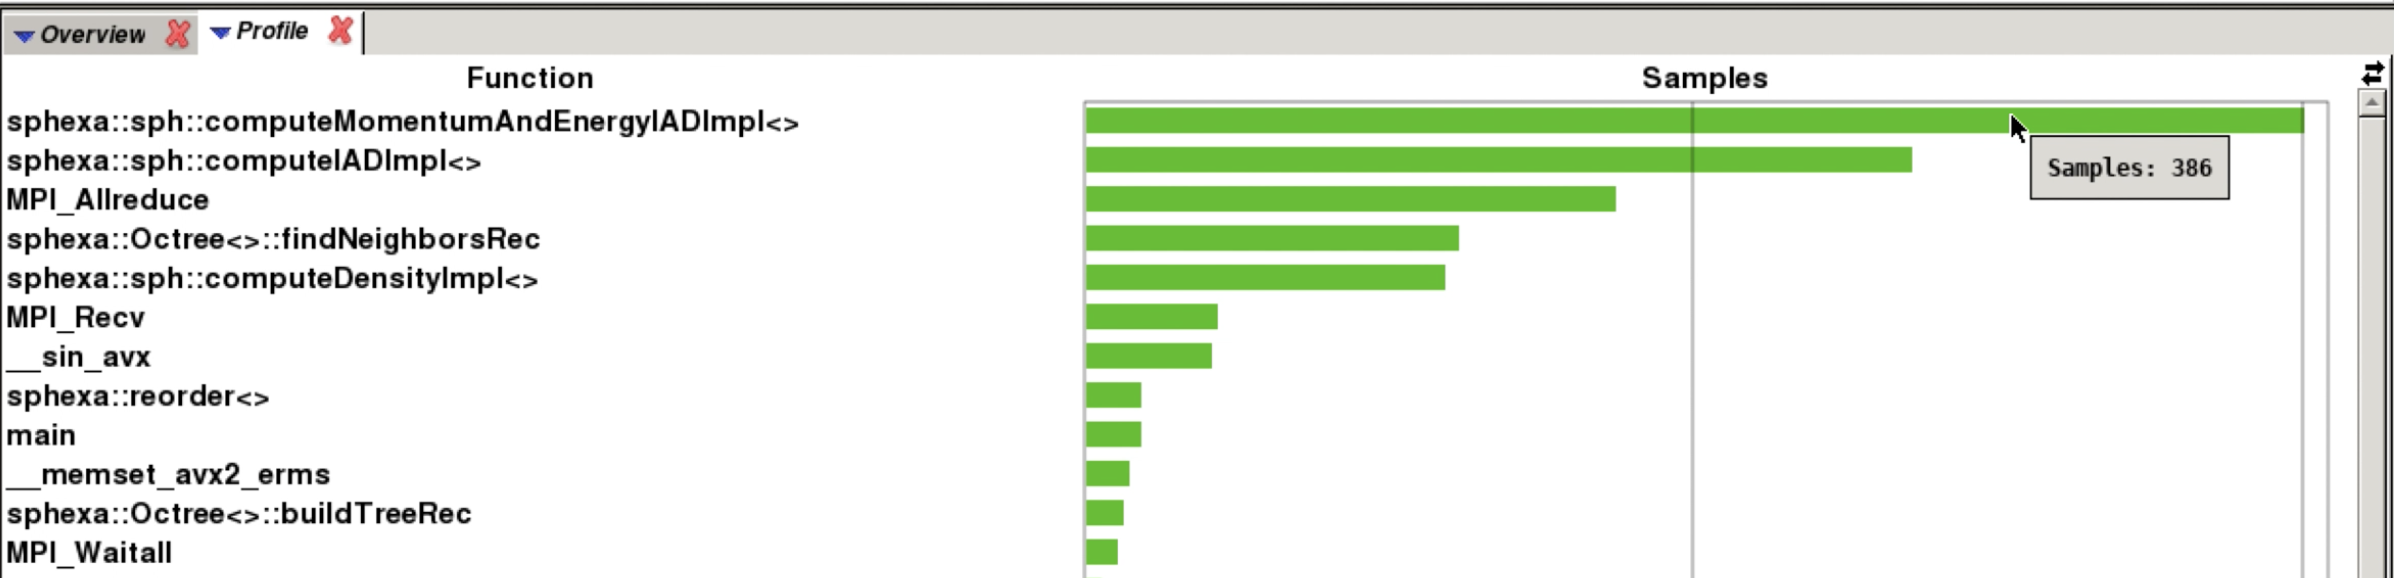
Apprentice2 (profile)
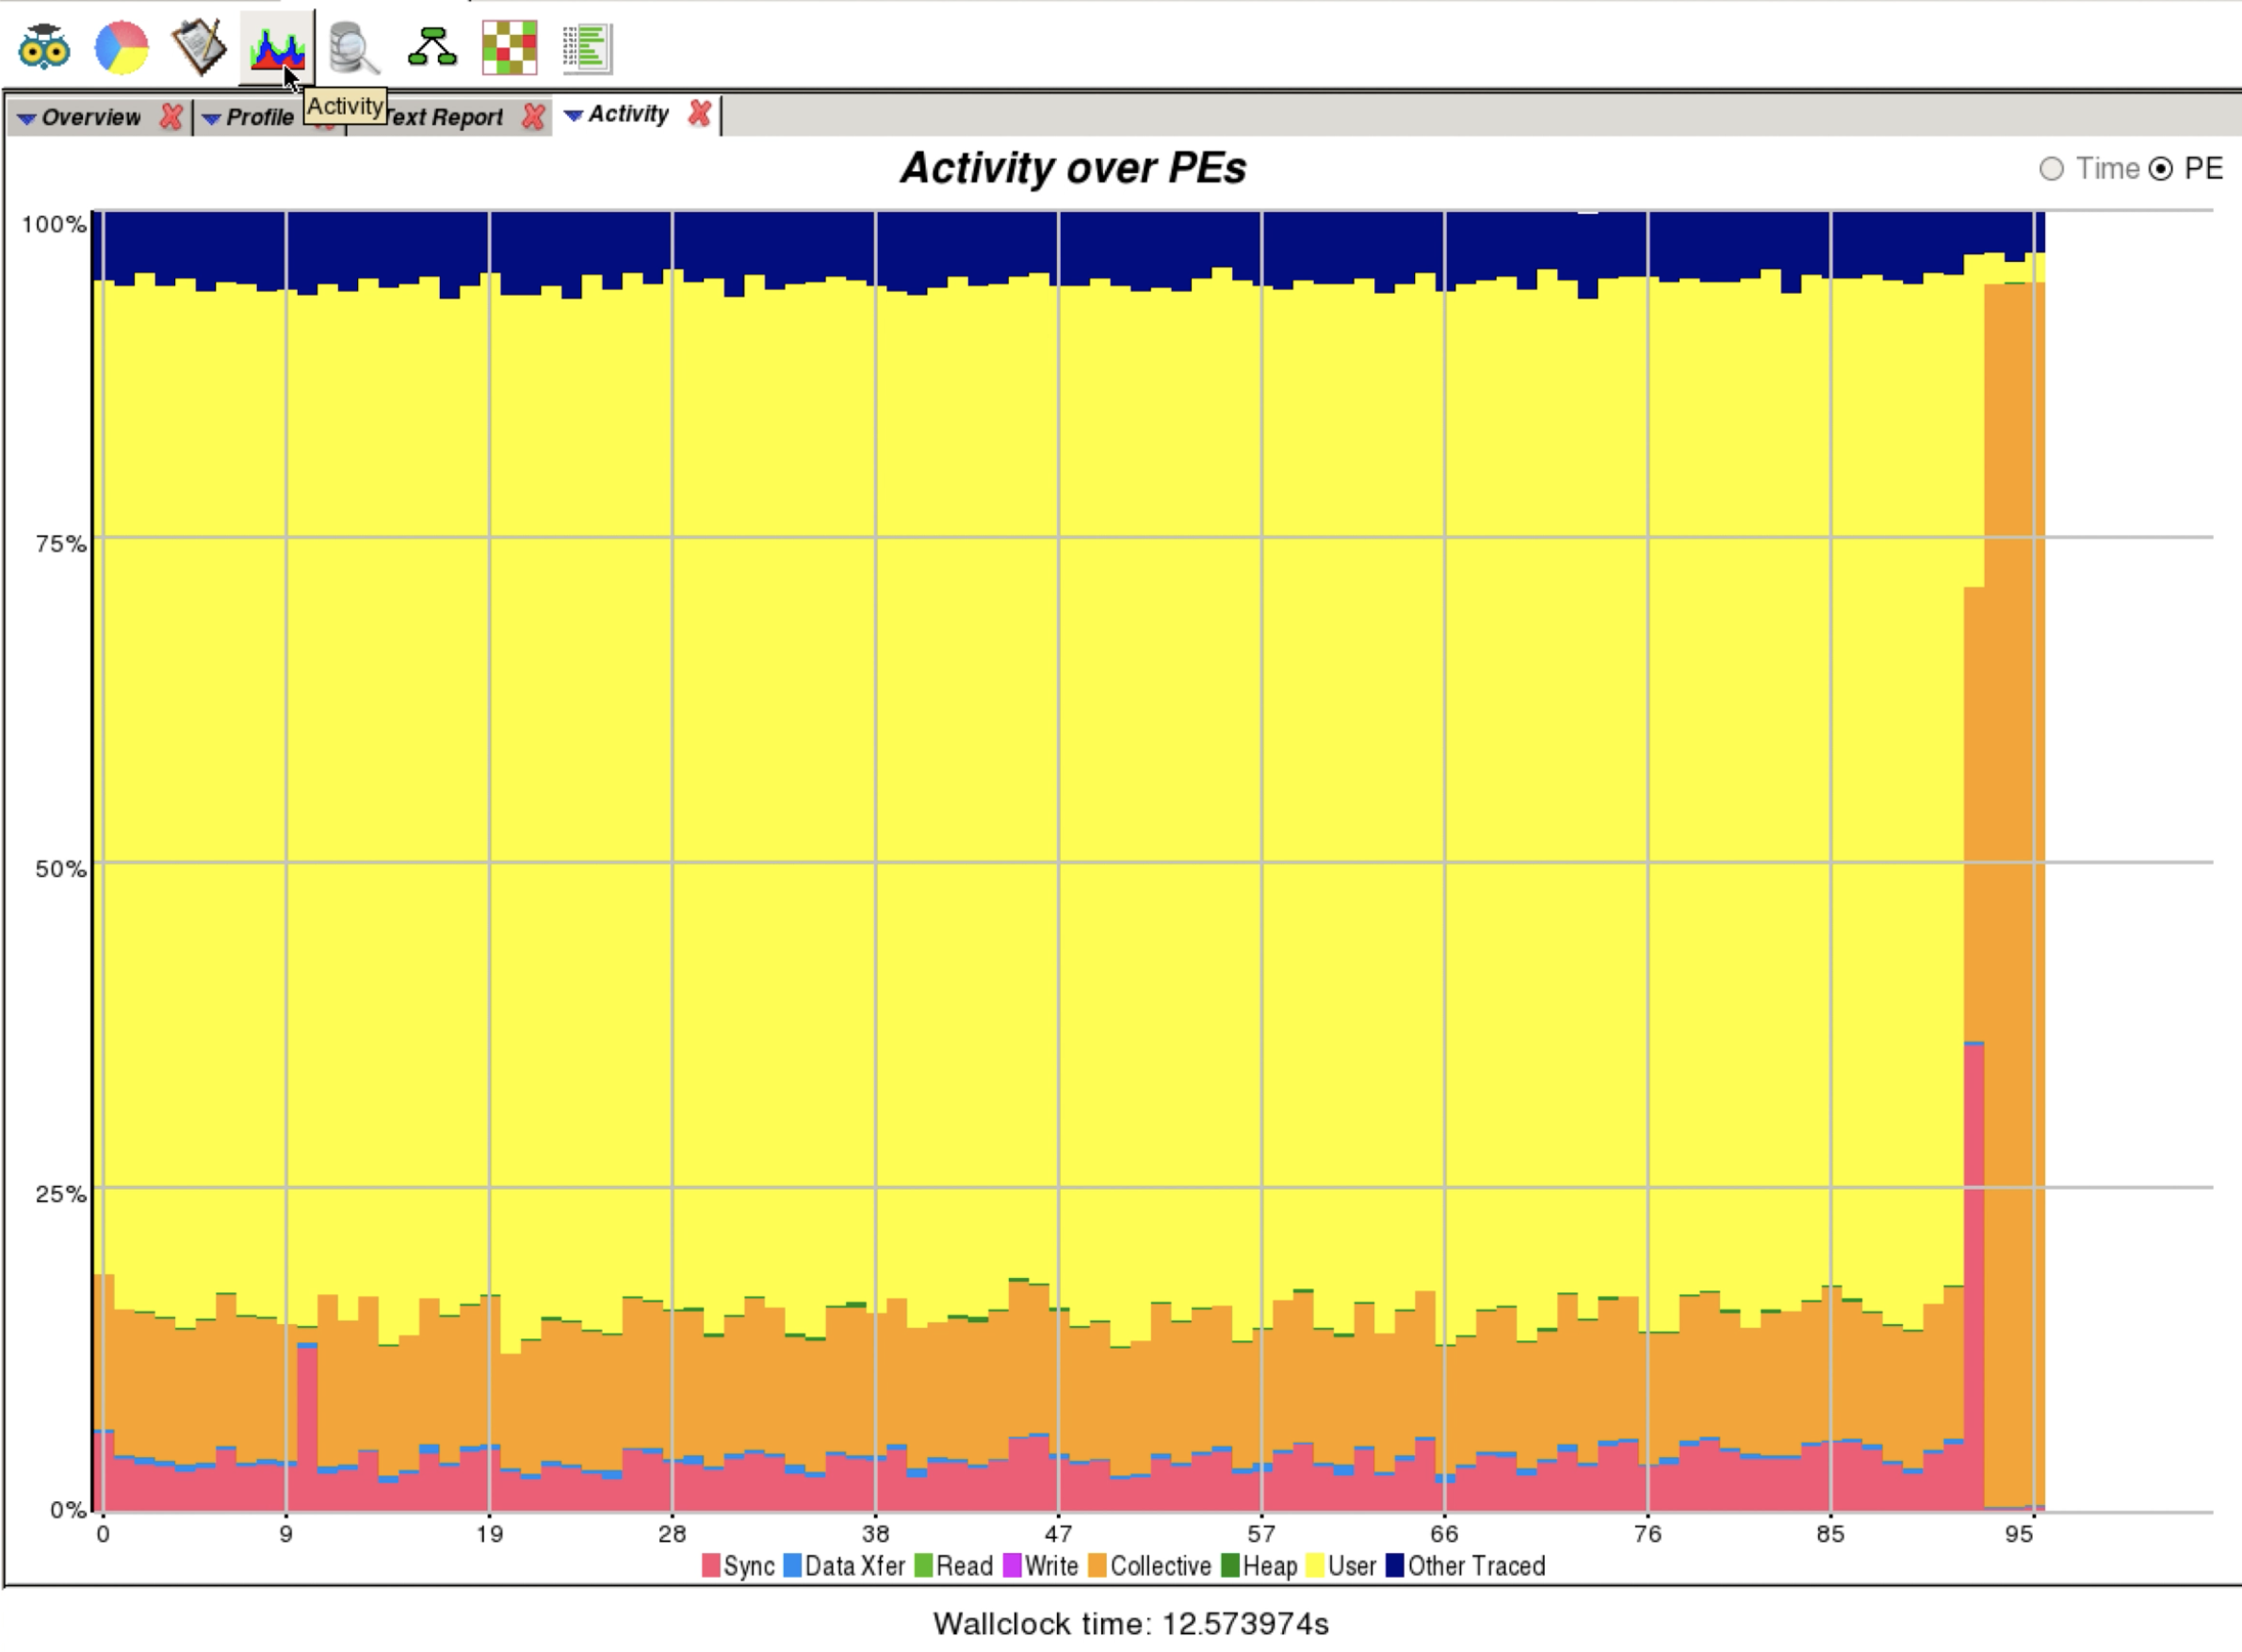
Apprentice2 (timeline)
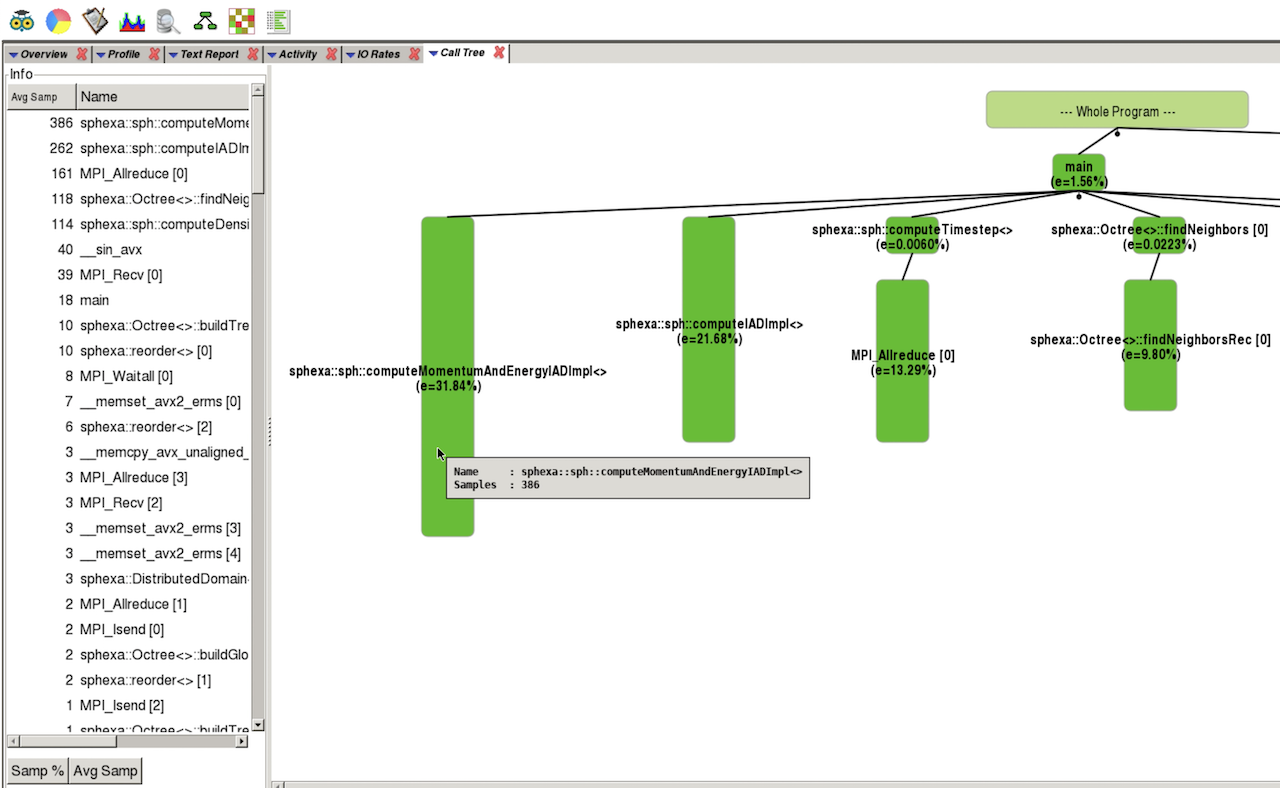
Apprentice2 (calltree)
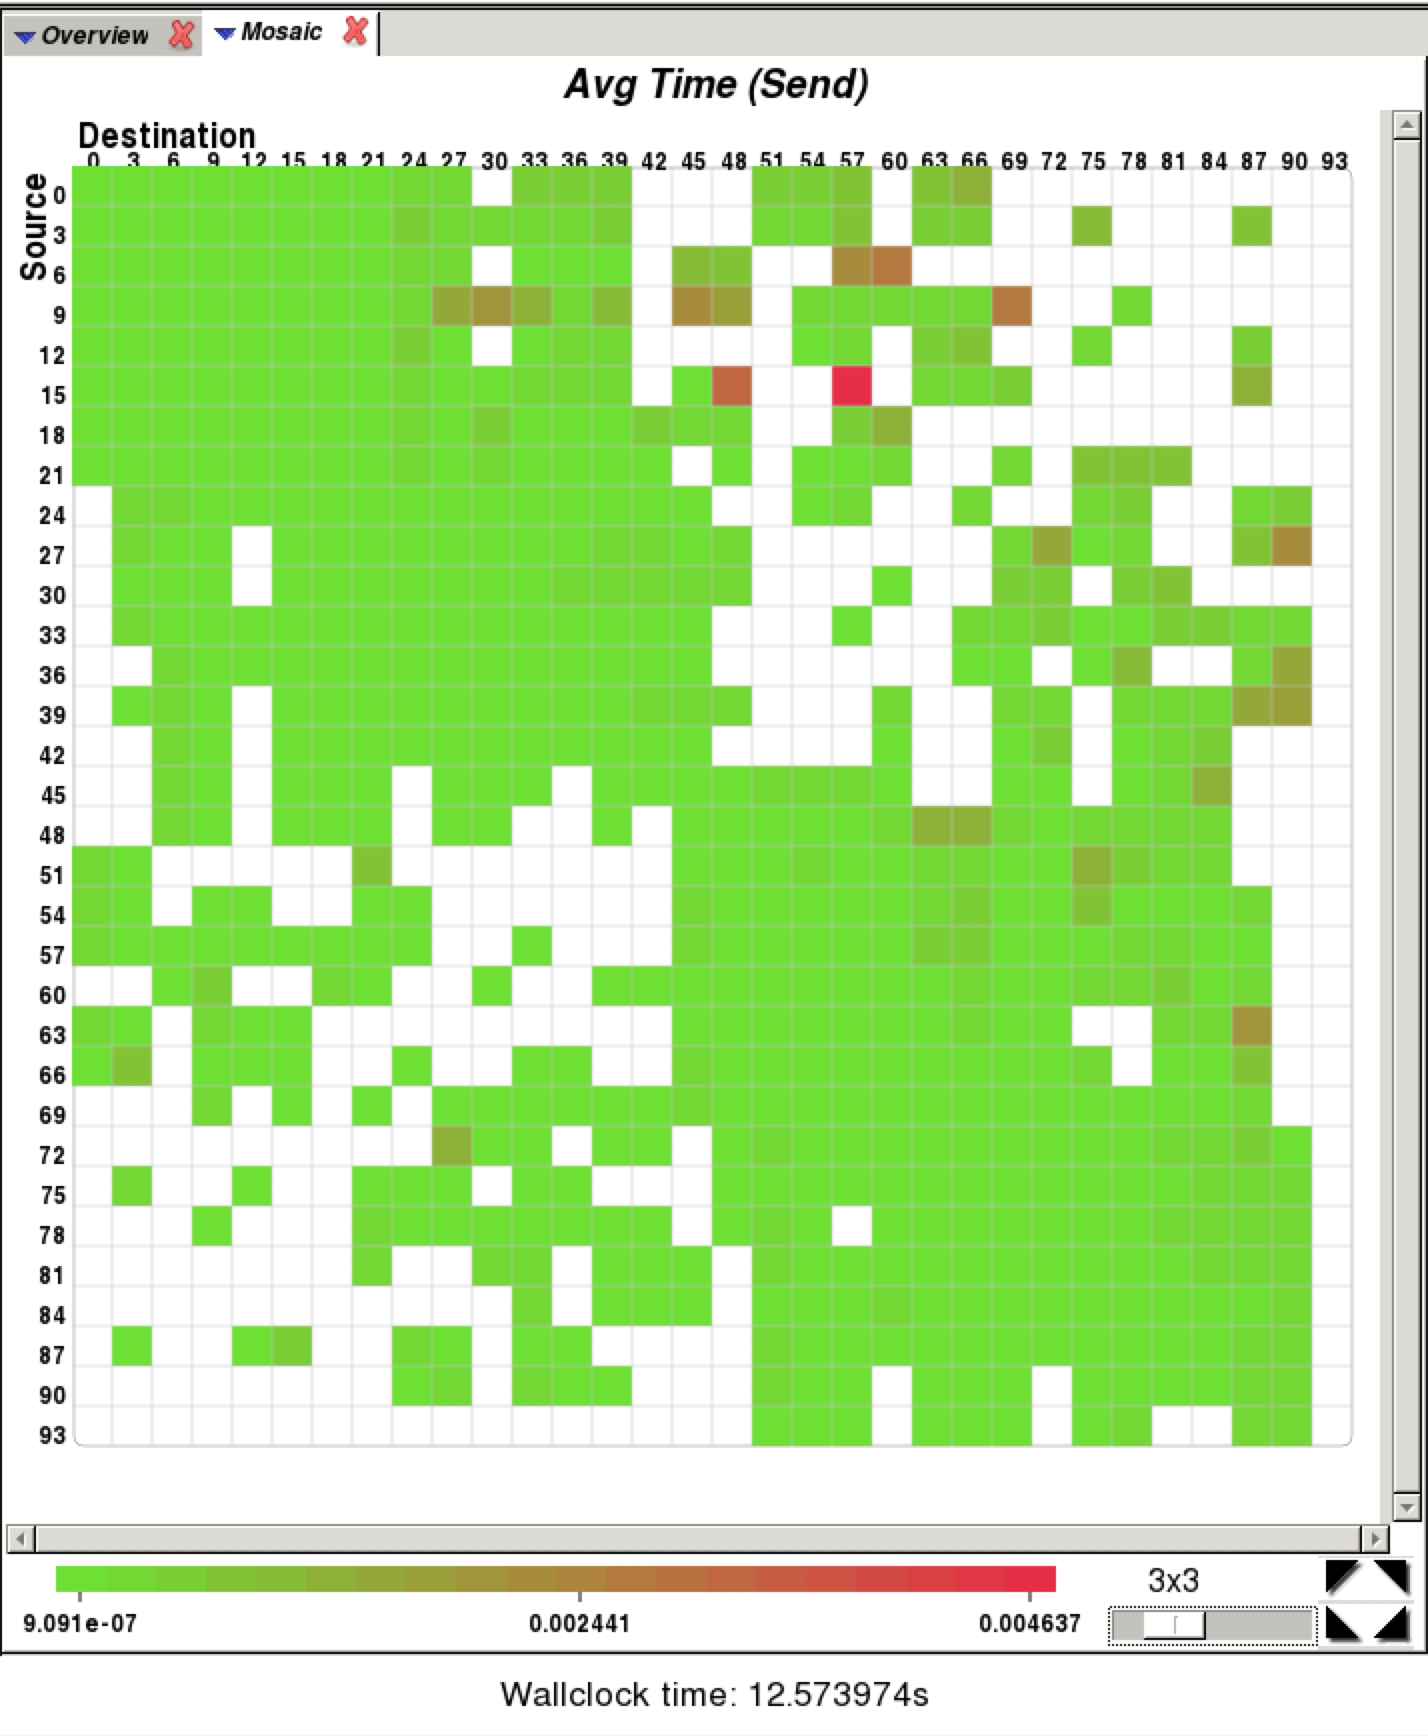
Apprentice2 (communication matrix)