Arm Forge DDT
Arm Forge DDT is a licensed
tool that can be used for debugging serial, multi-threaded (OpenMP),
multi-process (MPI) and accelerator based (Cuda, OpenACC) programs running on
research and production systems, including the CRAY Piz Daint system. It can be
executed either as a graphical user interface (ddt --connect mode or just ddt)
or from the command-line (ddt --offline mode).
Running the test
The test can be run from the command-line:
module load reframe
cd hpctools.git/reframechecks/debug/

~/reframe.git/reframe.py \
-C ~/reframe.git/config/cscs.py \
--system daint:gpu \
--prefix=$SCRATCH -r \
-p PrgEnv-gnu \
--keep-stage-files \
-c ./arm_ddt.py
A successful ReFrame output will look like the following:
Reframe version: 3.0-dev6 (rev: e0f8d969)
Launched on host: daint101

[---] waiting for spawned checks to finish
[ OK ] (1/1) sphexa_ddt_sqpatch_024mpi_001omp_35n_2steps on daint:gpu using PrgEnv-gnu
[---] all spawned checks have finished

[  PASSED  ] Ran 1 test case(s) from 1 check(s) (0 failure(s))
Looking into the Class shows how to setup and run
the code with the tool. In this case, the code is
knowingly written in order that the mpi ranks other than 0, 1 and 2 will call
MPI::COMM_WORLD.Abort thus making the execution to crash.
Bug reporting
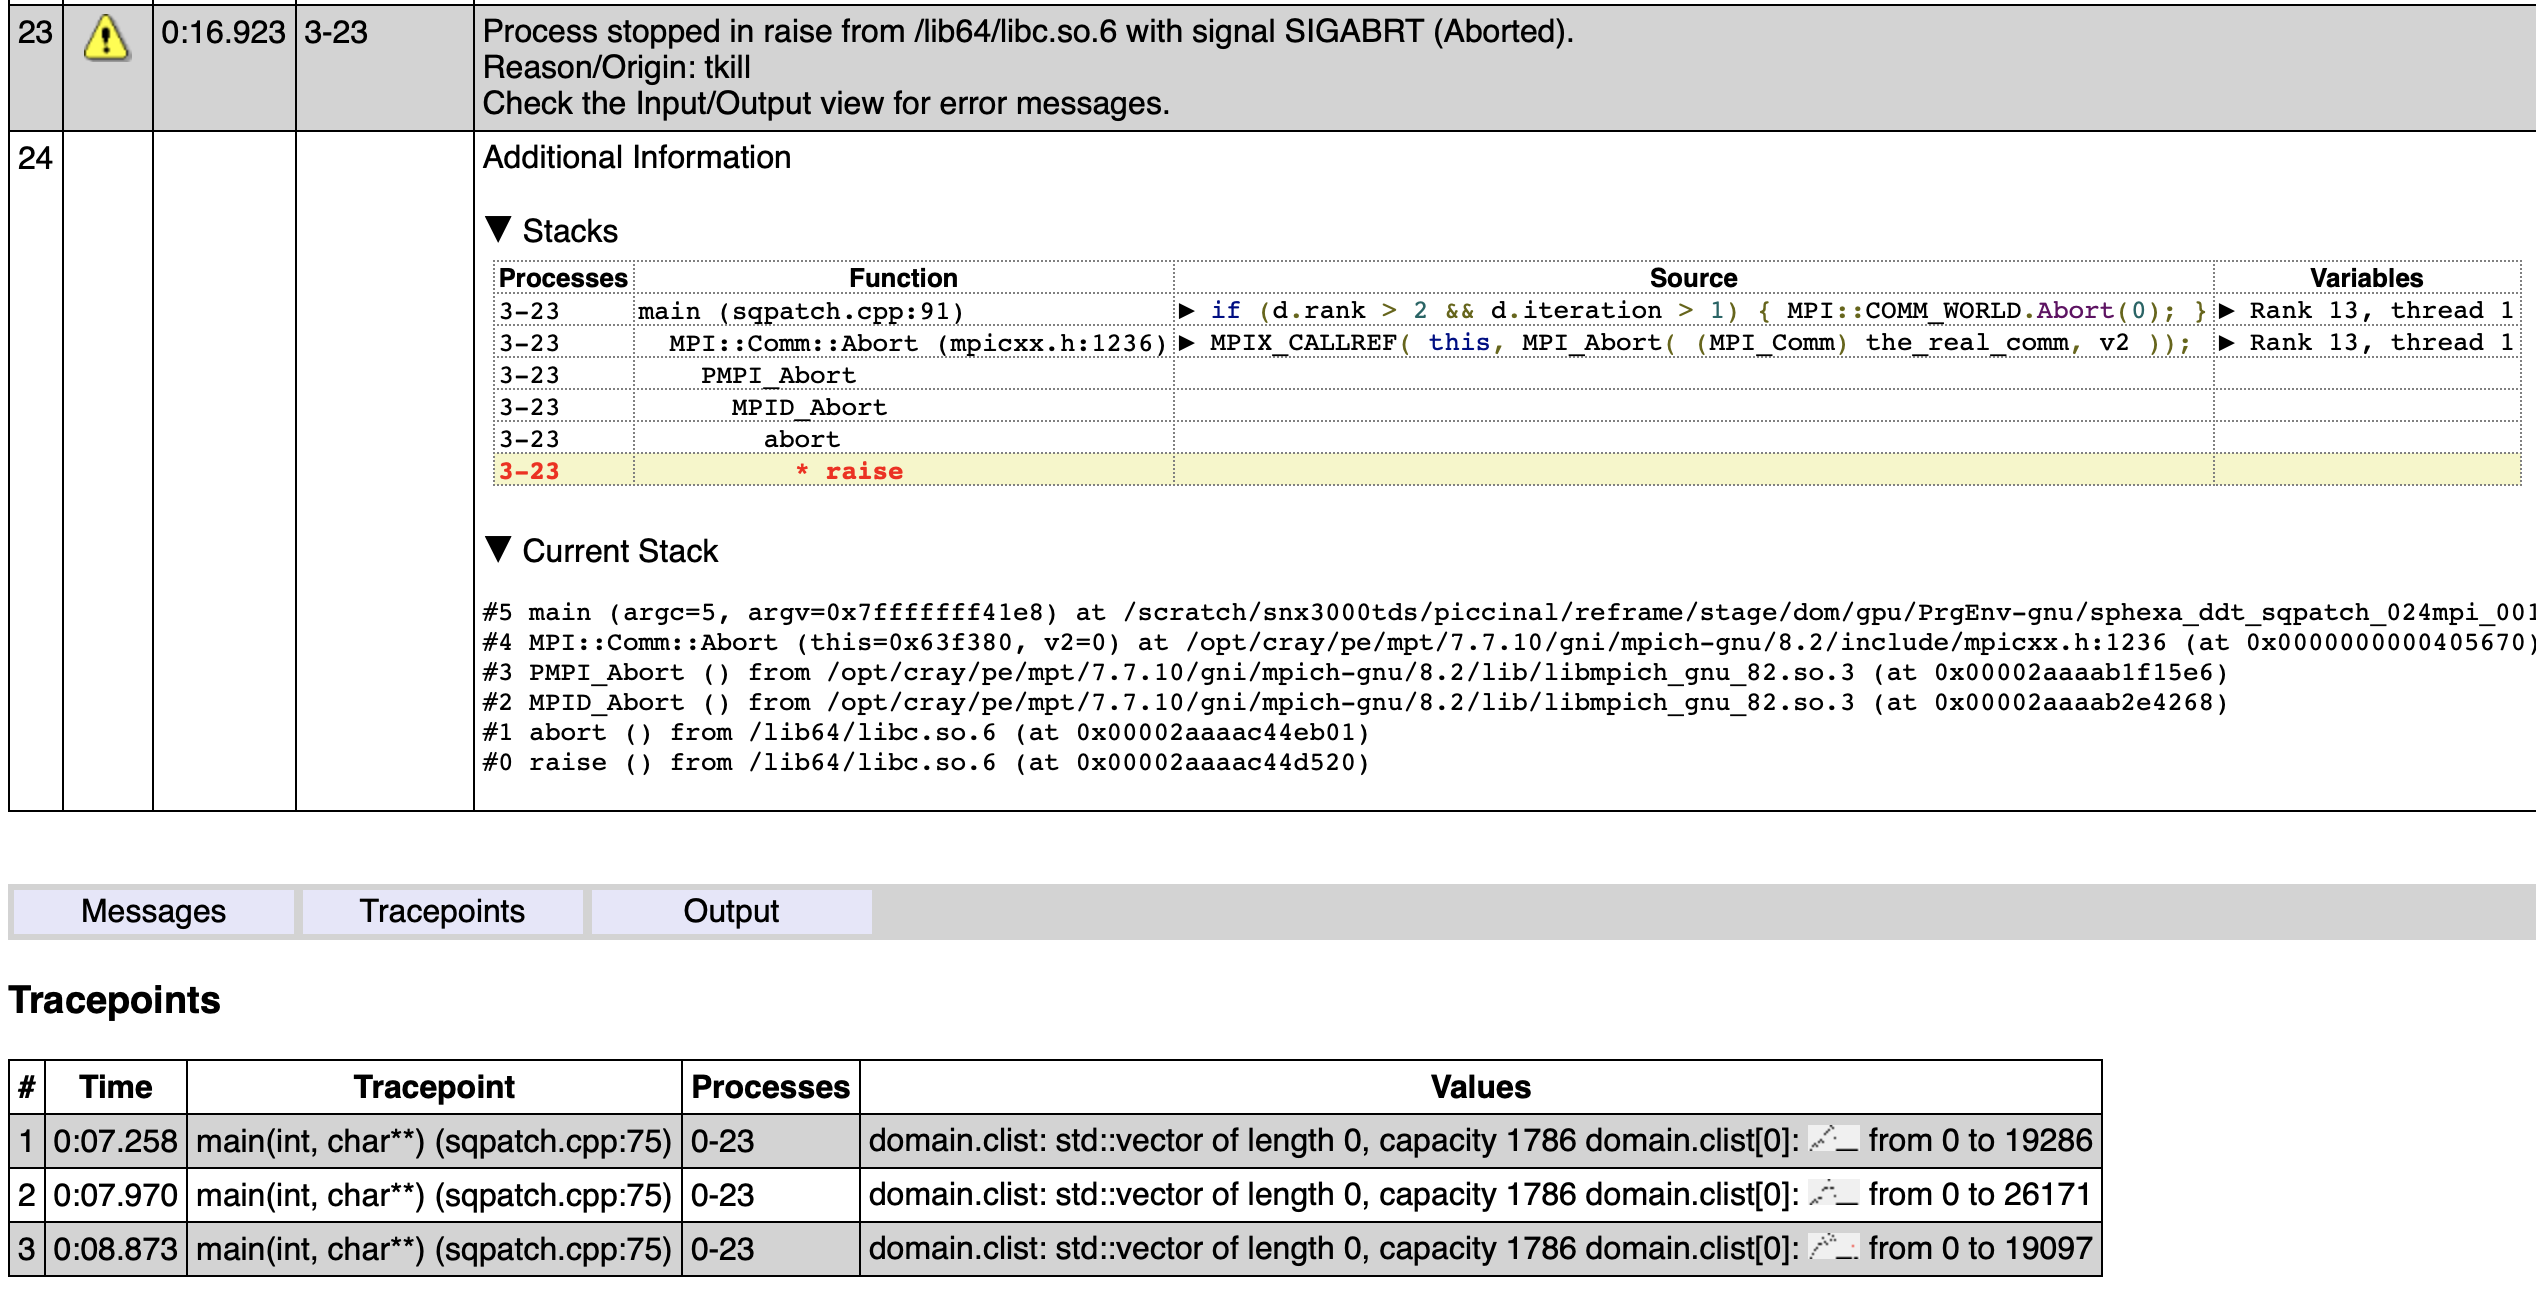
An overview of the debugging data will typically look like this:
Tracepoints

#   Time      Tracepoint    Processes                                             Values
           main(int,                  domain.clist: std::vector of length 0, capacity 1786 domain.clist[0]: Sparkline
1 0:07.258 char**)          0-23      from 0 to 19286
           (sqpatch.cpp:75)
           main(int,                  domain.clist: std::vector of length 0, capacity 1786 domain.clist[0]: Sparkline
2 0:07.970 char**)          0-23      from 0 to 26171
           (sqpatch.cpp:75)
           main(int,                  domain.clist: std::vector of length 0, capacity 1786 domain.clist[0]: Sparkline
3 0:08.873 char**)          0-23      from 0 to 19097
           (sqpatch.cpp:75)
The same data can be viewed with a web browser:
ARM Forge DDT html report (created with --offline --output=rpt.html)
In the same way, using DDT gui will give the same result and more insight about the crash of the code:
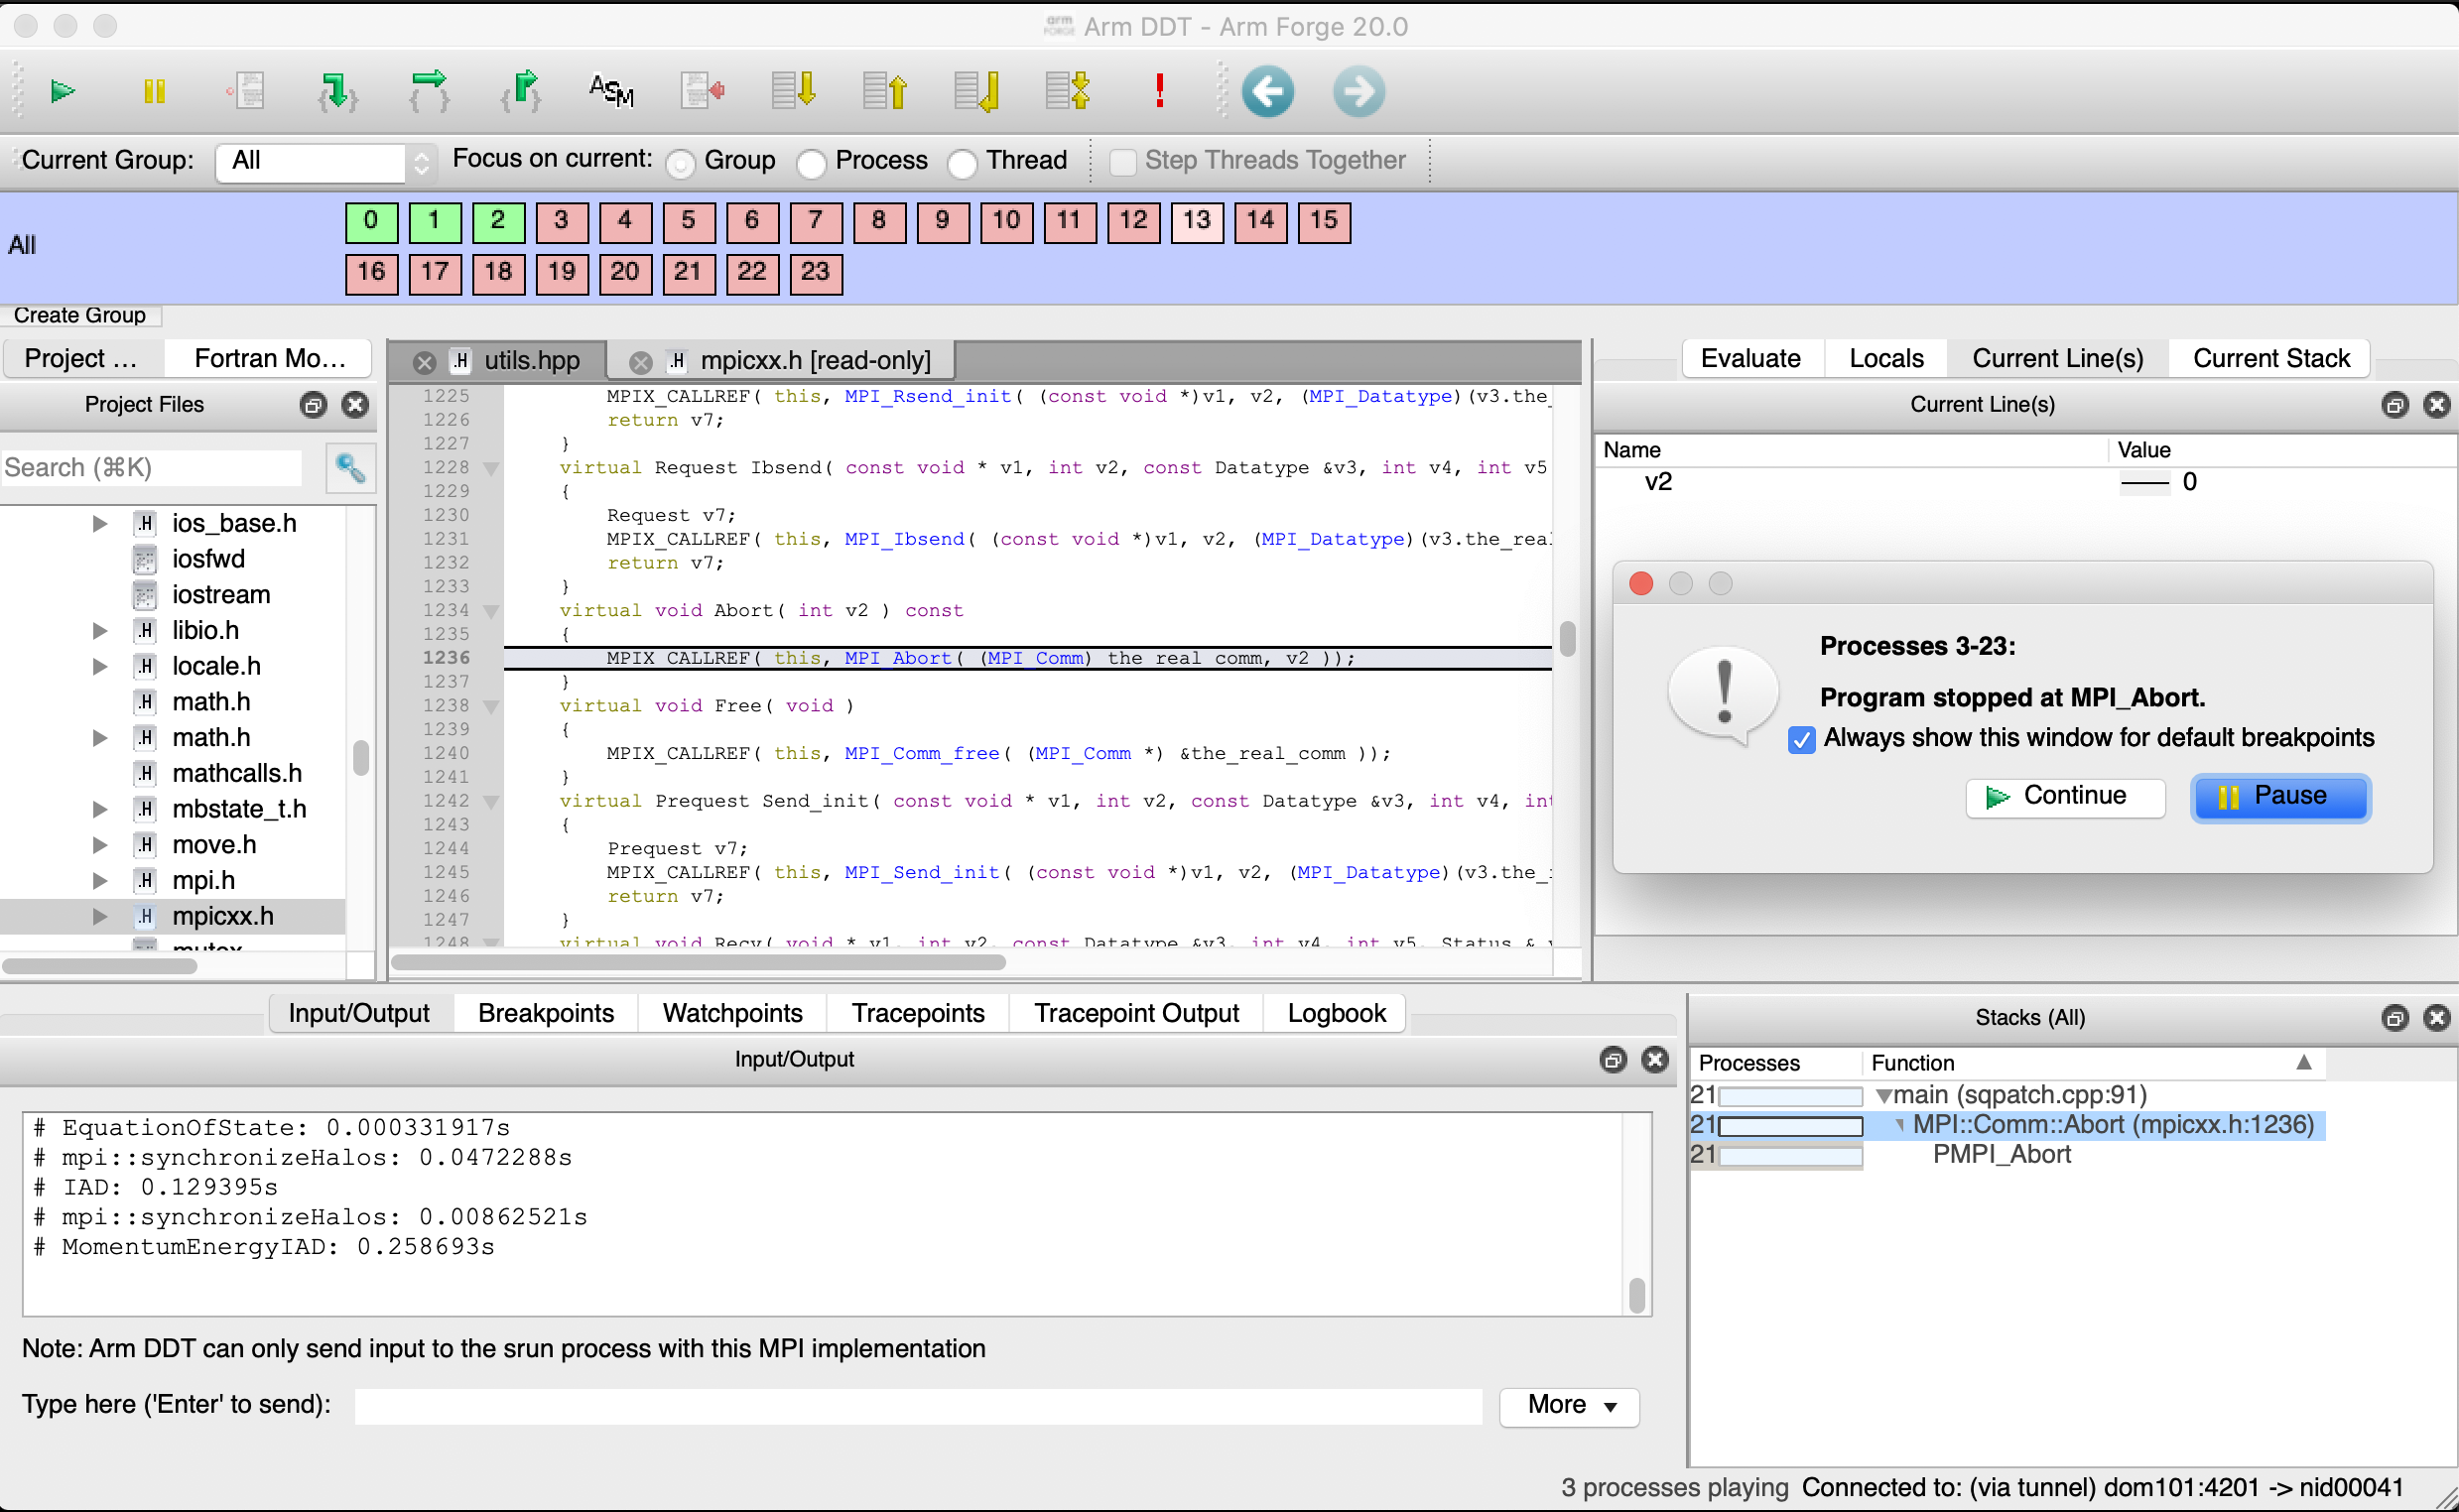
ARM Forge DDT (All mpi ranks (except 0, 1 and 2) aborted)
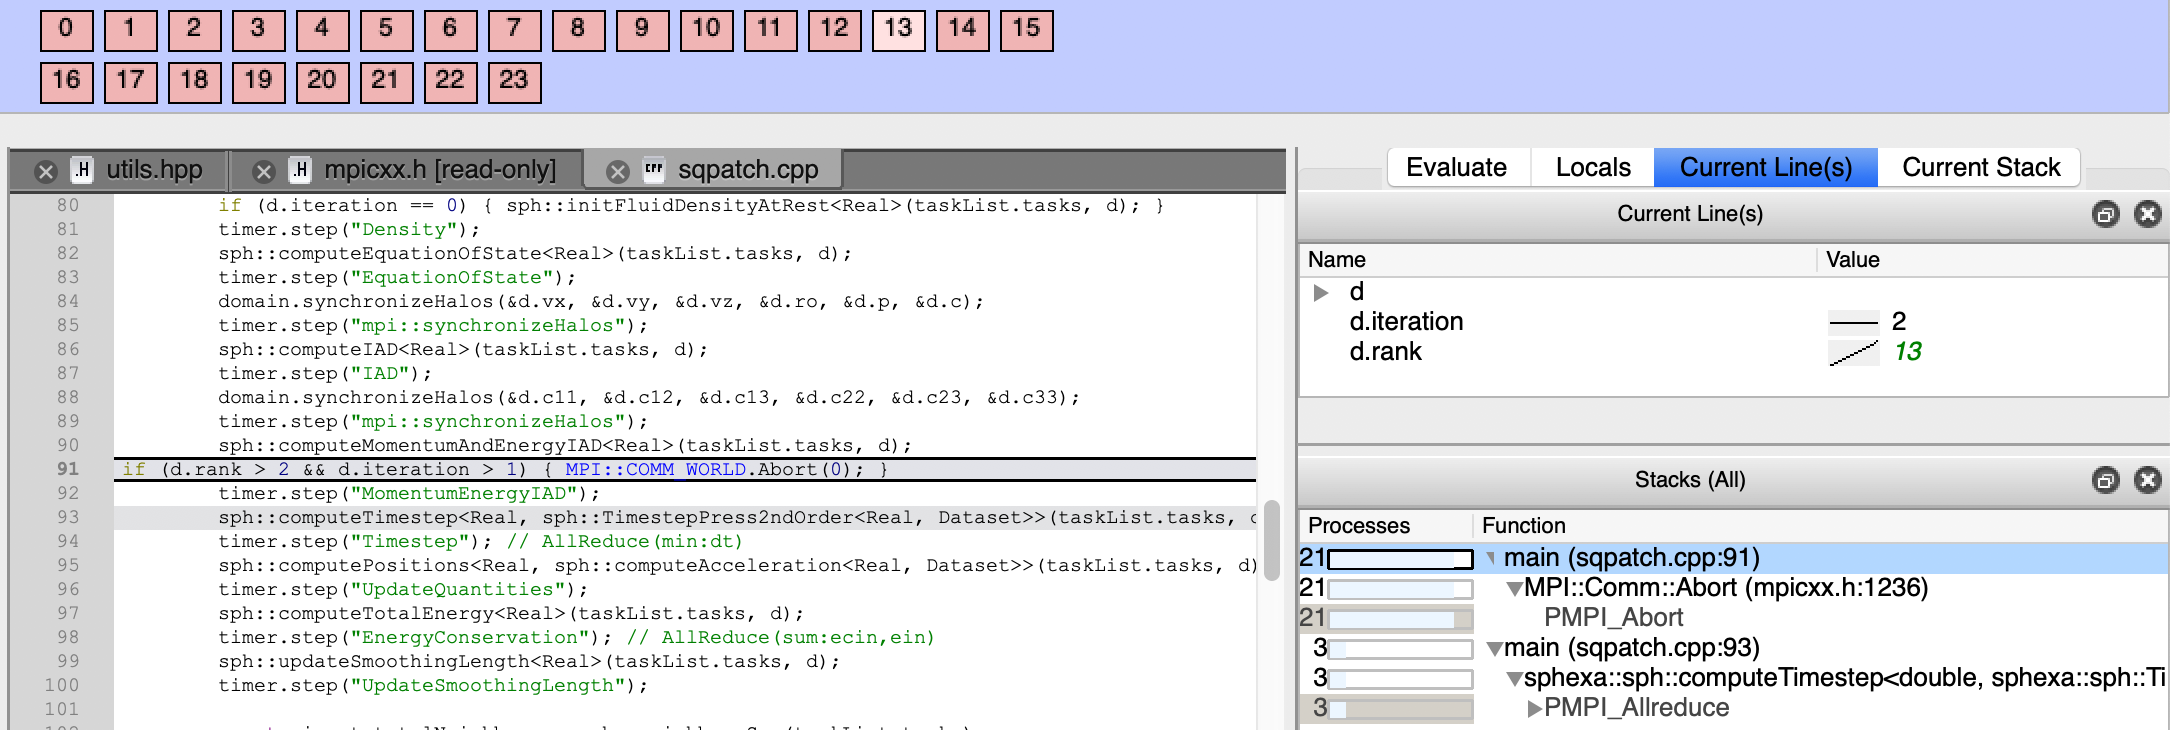
ARM Forge DDT (callstack)