NVIDIA CUDA and ARM Forge DDT
Arm Forge DDT can be used for debugging GPU parallel codes.
Running the test
The test can be run from the command-line:
module load reframe
cd hpctools.git/reframechecks/debug/

~/reframe.git/reframe.py \
-C ~/reframe.git/config/cscs.py \
--system daint:gpu \
--prefix=$SCRATCH -r \
-p PrgEnv-gnu \
--keep-stage-files \
-c ./arm_ddt_cuda.py
A successful ReFrame output will look like the following:
[----------] started processing sphexa_cudaddt_sqpatch_001mpi_001omp_30n_0steps (Tool validation)
[ RUN      ] sphexa_cudaddt_sqpatch_001mpi_001omp_30n_0steps on daint:gpu using PrgEnv-gnu
[----------] finished processing sphexa_cudaddt_sqpatch_001mpi_001omp_30n_0steps (Tool validation)

[----------] waiting for spawned checks to finish
[       OK ] (1/1) sphexa_cudaddt_sqpatch_001mpi_001omp_30n_0steps on daint:gpu using PrgEnv-gnu
[----------] all spawned checks have finished

[  PASSED  ] Ran 1 test case(s) from 1 check(s) (0 failure(s))
==============================================================================
PERFORMANCE REPORT
------------------------------------------------------------------------------
sphexa_cudaddt_sqpatch_001mpi_001omp_30n_0steps
- daint:gpu
   - PrgEnv-gnu
      * num_tasks: 1
      * elapsed: 113 s
------------------------------------------------------------------------------
Looking into the Class
shows how to setup and run the code with the tool.
Bug reporting
DDT will automatically set a breakpoint at the entrance of cuda kernels.
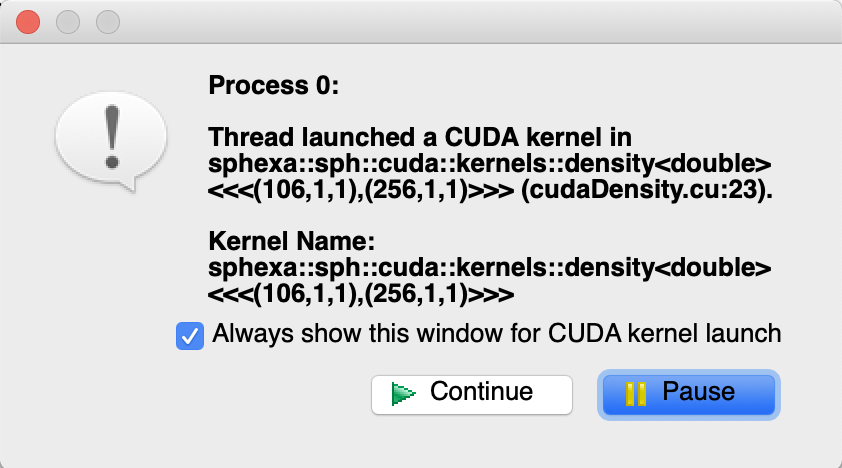
Arm Forge DDT break on cuda kernel launch
In this example, the first cuda kernel to be launched is the density kernel:
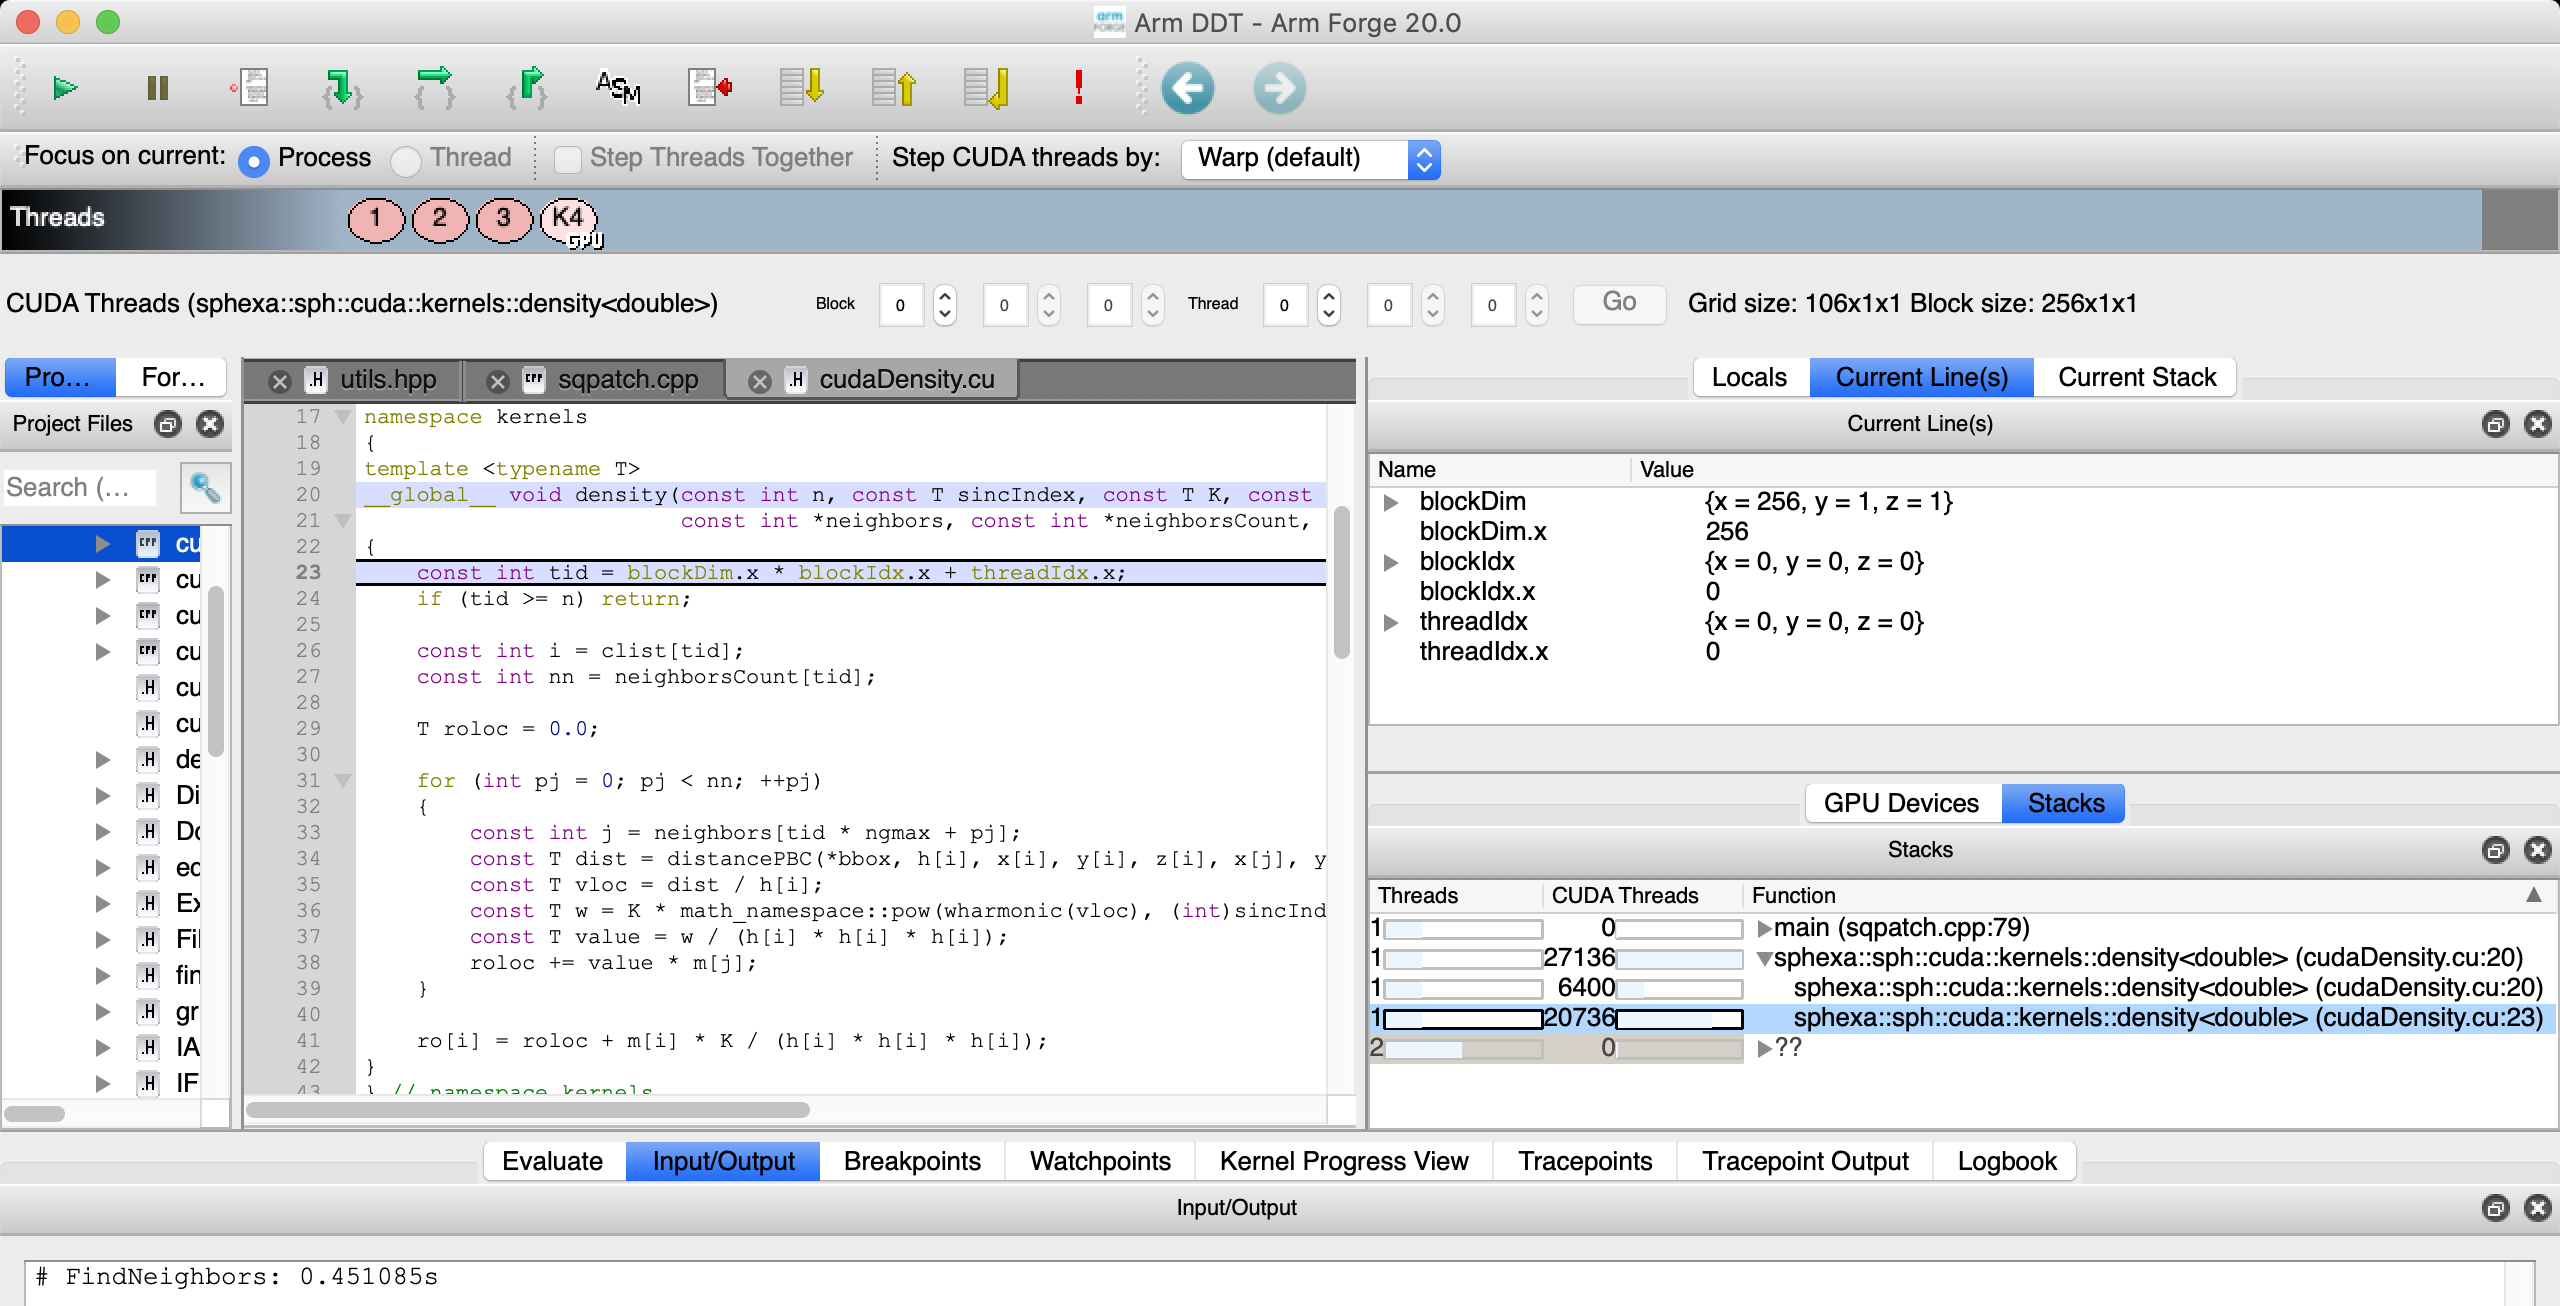
Arm Forge DDT density kernel (block 0, thread 0)
The Thread Selector allows to select a gpu thread and/or threadblock.
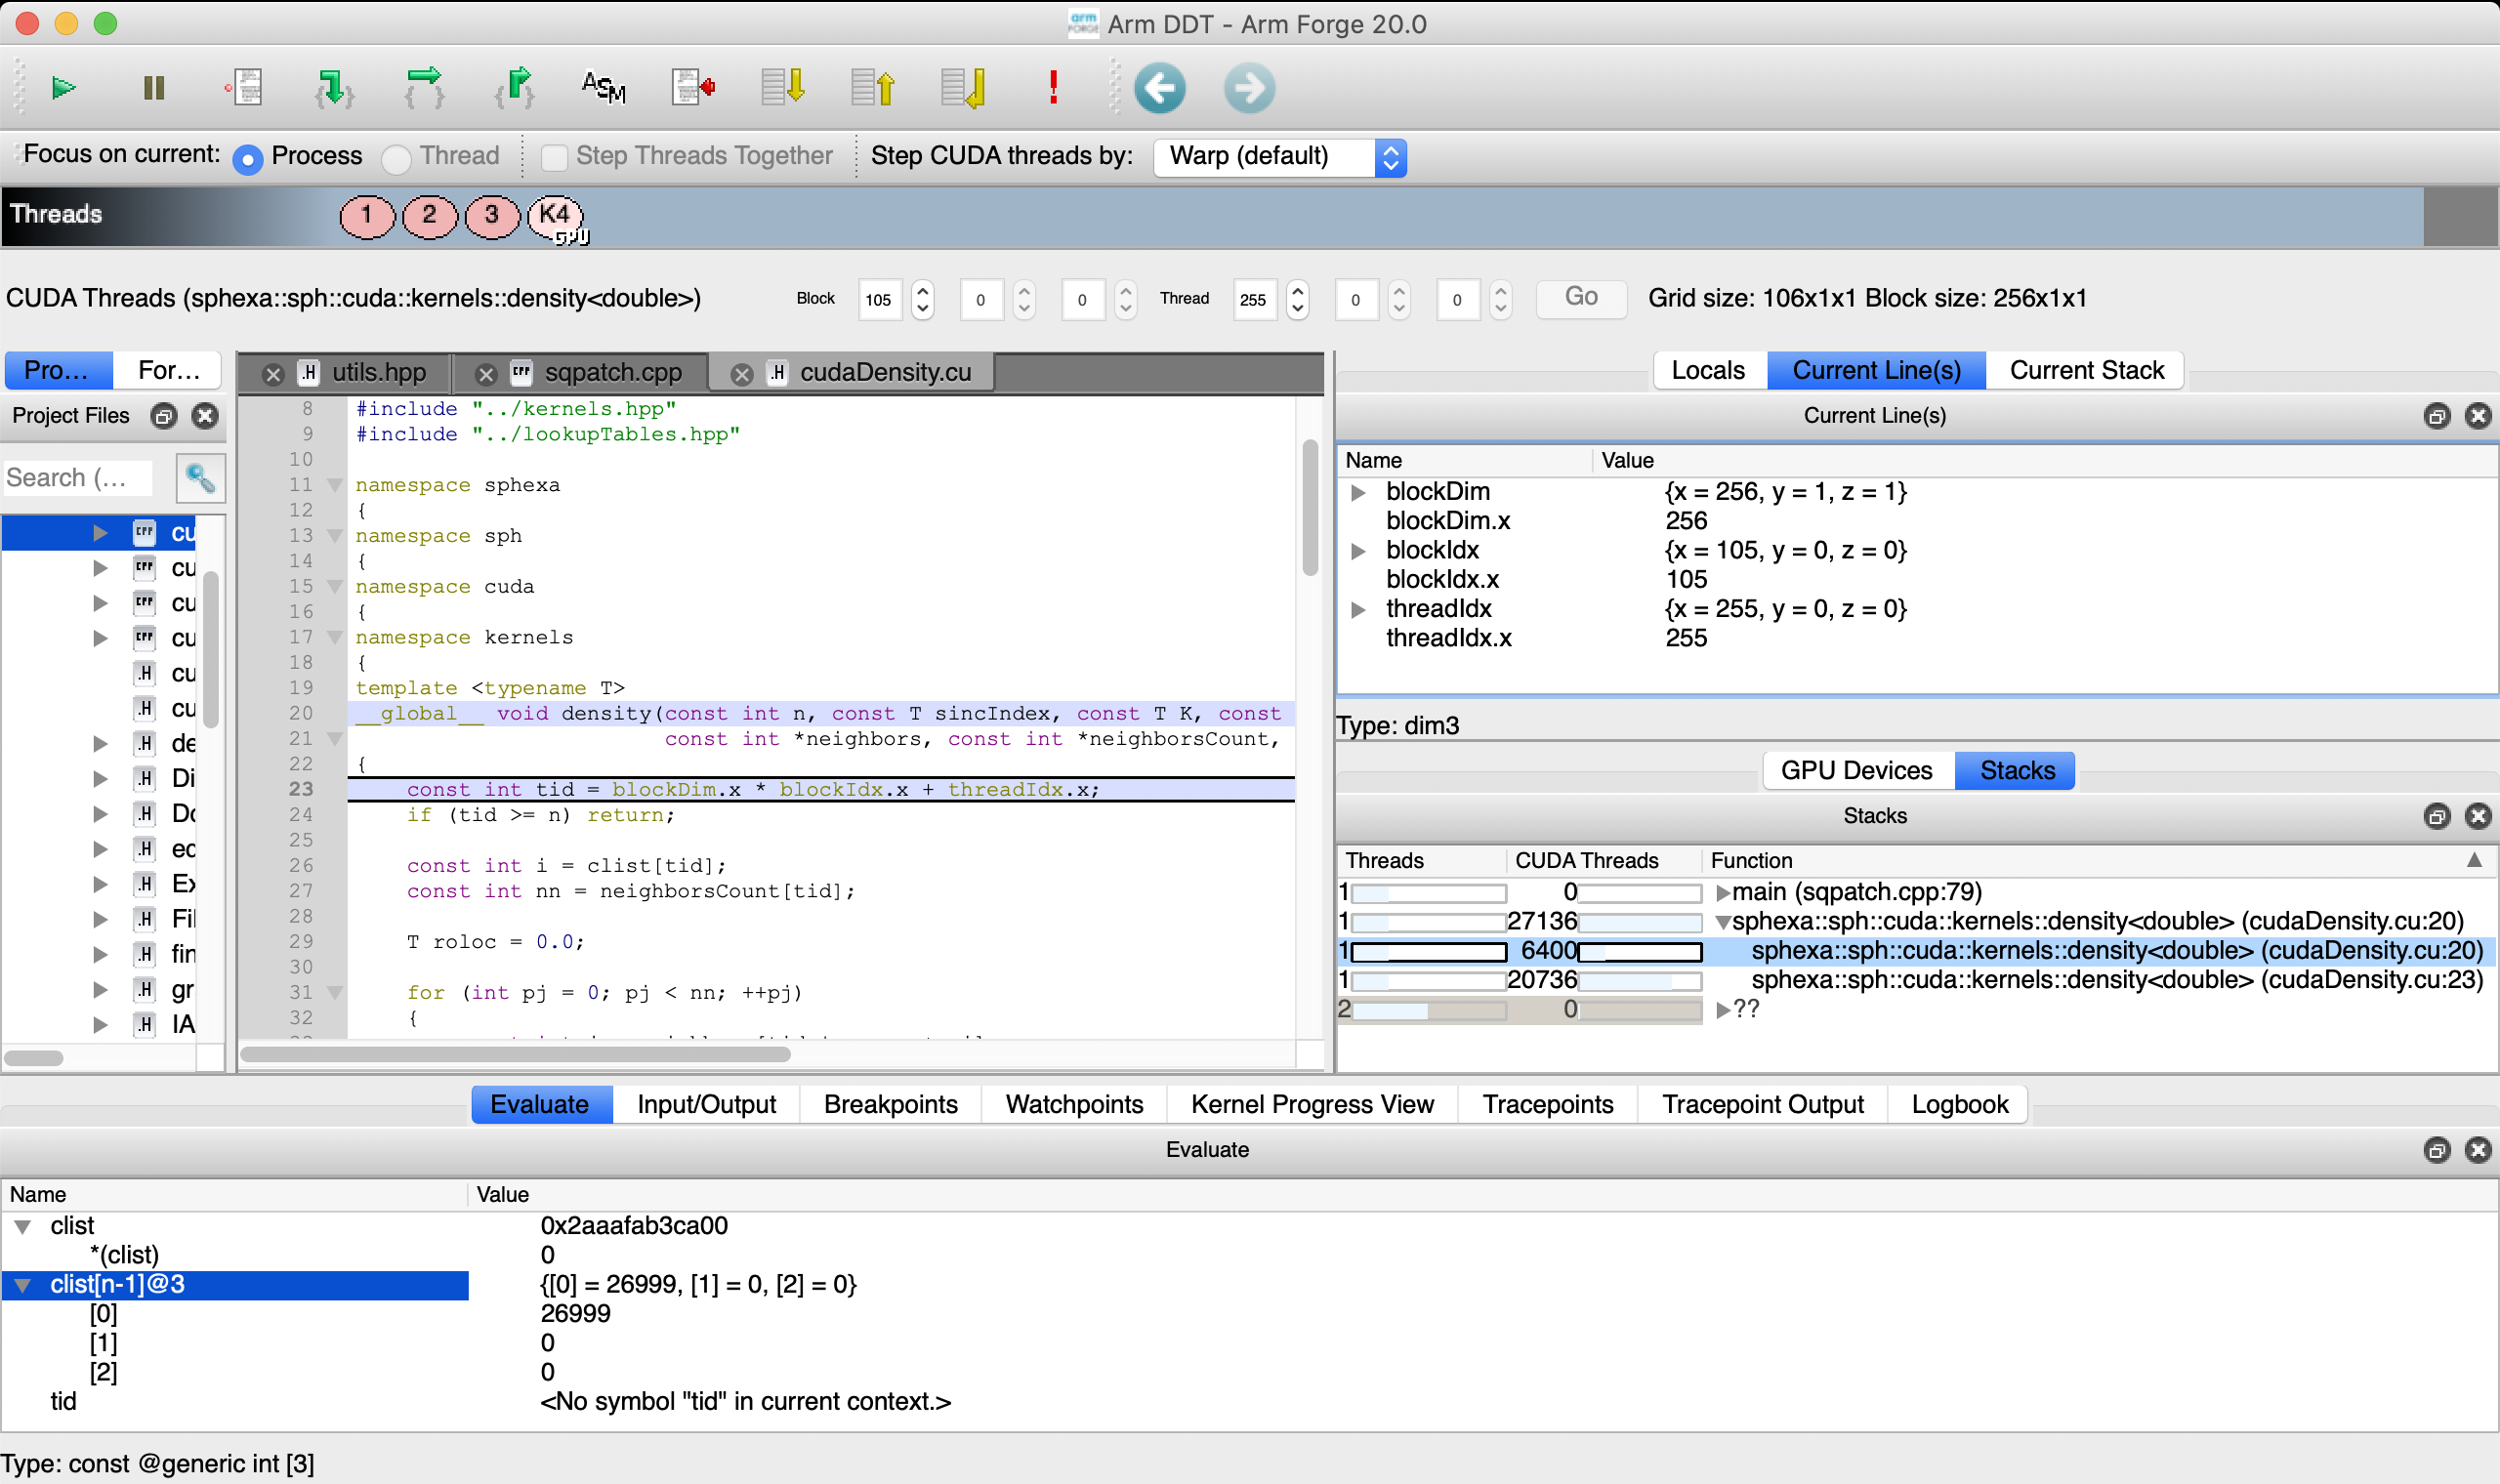
Arm Forge DDT density kernel (last block, last thread)
Arm DDT also includes a GPU Devices display that gives information about the gpu device:
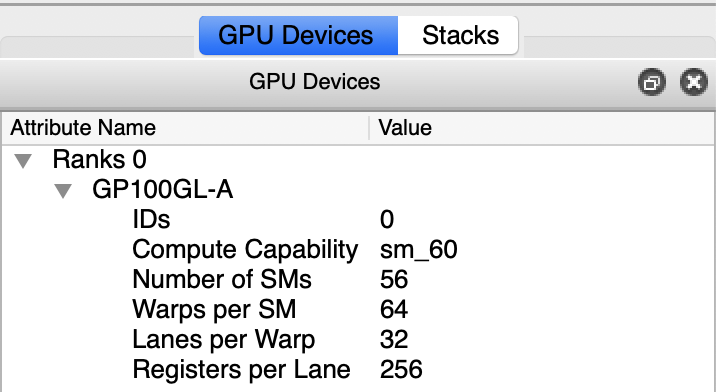
Arm Forge DDT gpu devices info
cuda |
thread |
warp |
sm |
P100 |
|---|---|---|---|---|
threads |
1 |
32 |
2’048 |
114’688 |
warps |
x |
1 |
64 |
3’584 |
sms |
x |
x |
1 |
56 |
P100 |
x |
x |
x |
1 |
It can be read as: one NVIDIA Pascal P100 gpu leverages up to 32 threads per warp, 2048 threads per sm, 114’688 threads per device, 64 warps per sm, 3’584 warps per device, 56 sms per device and so on.
As usual, it is possible to inspect variables on the cpu and on the gpu:
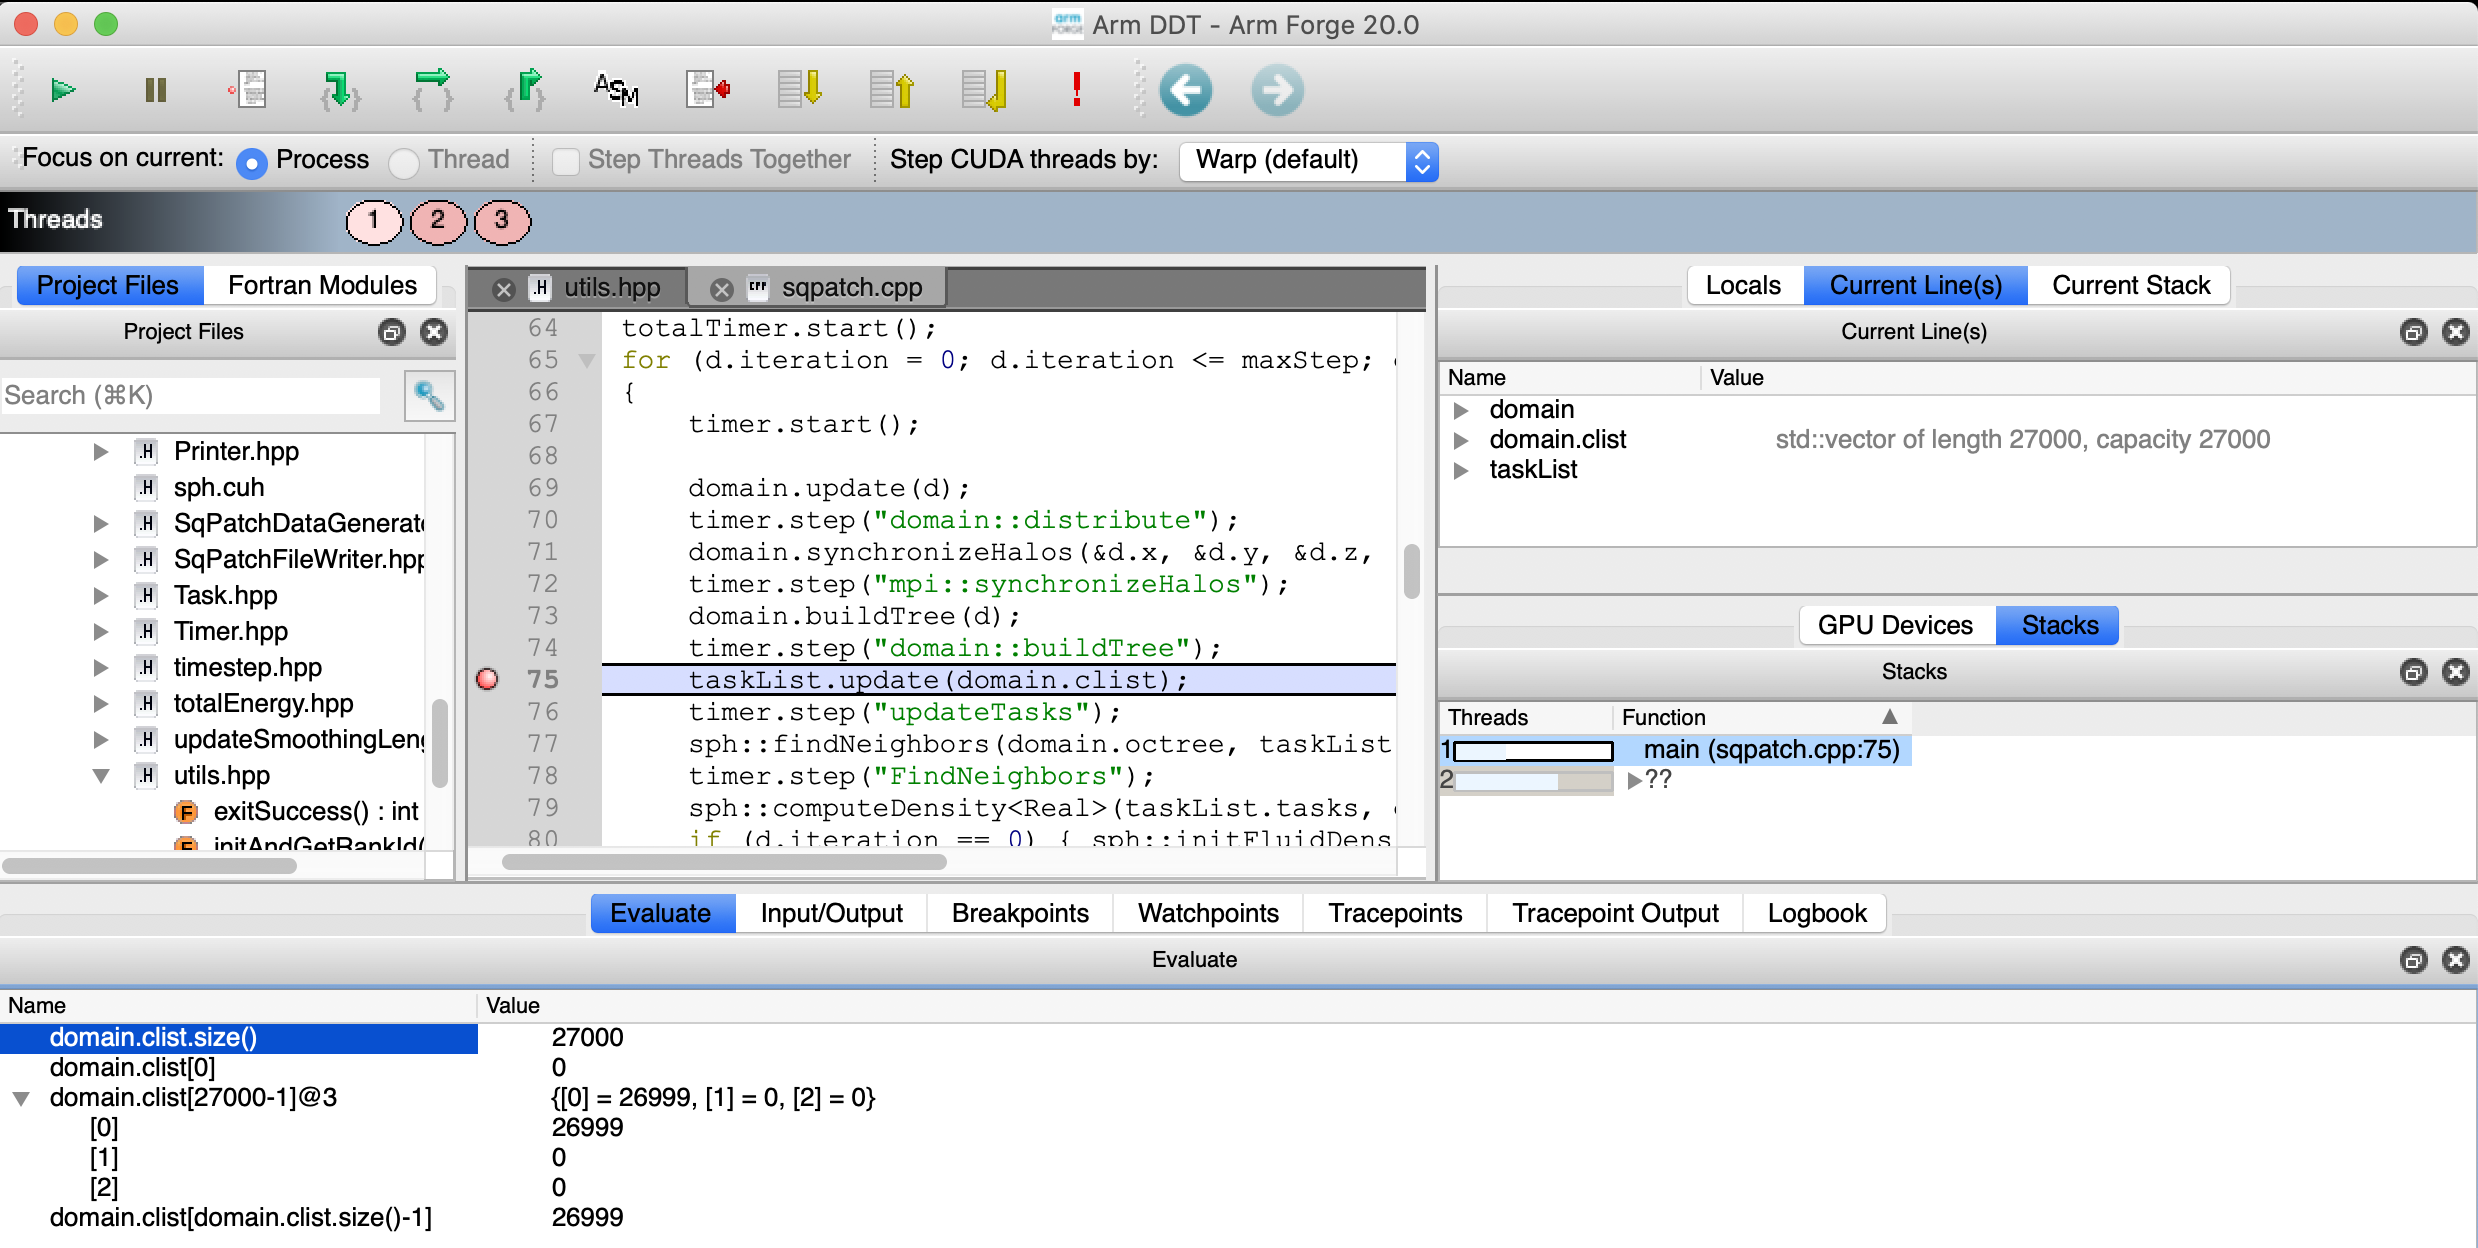
Arm Forge DDT variables (cpu)
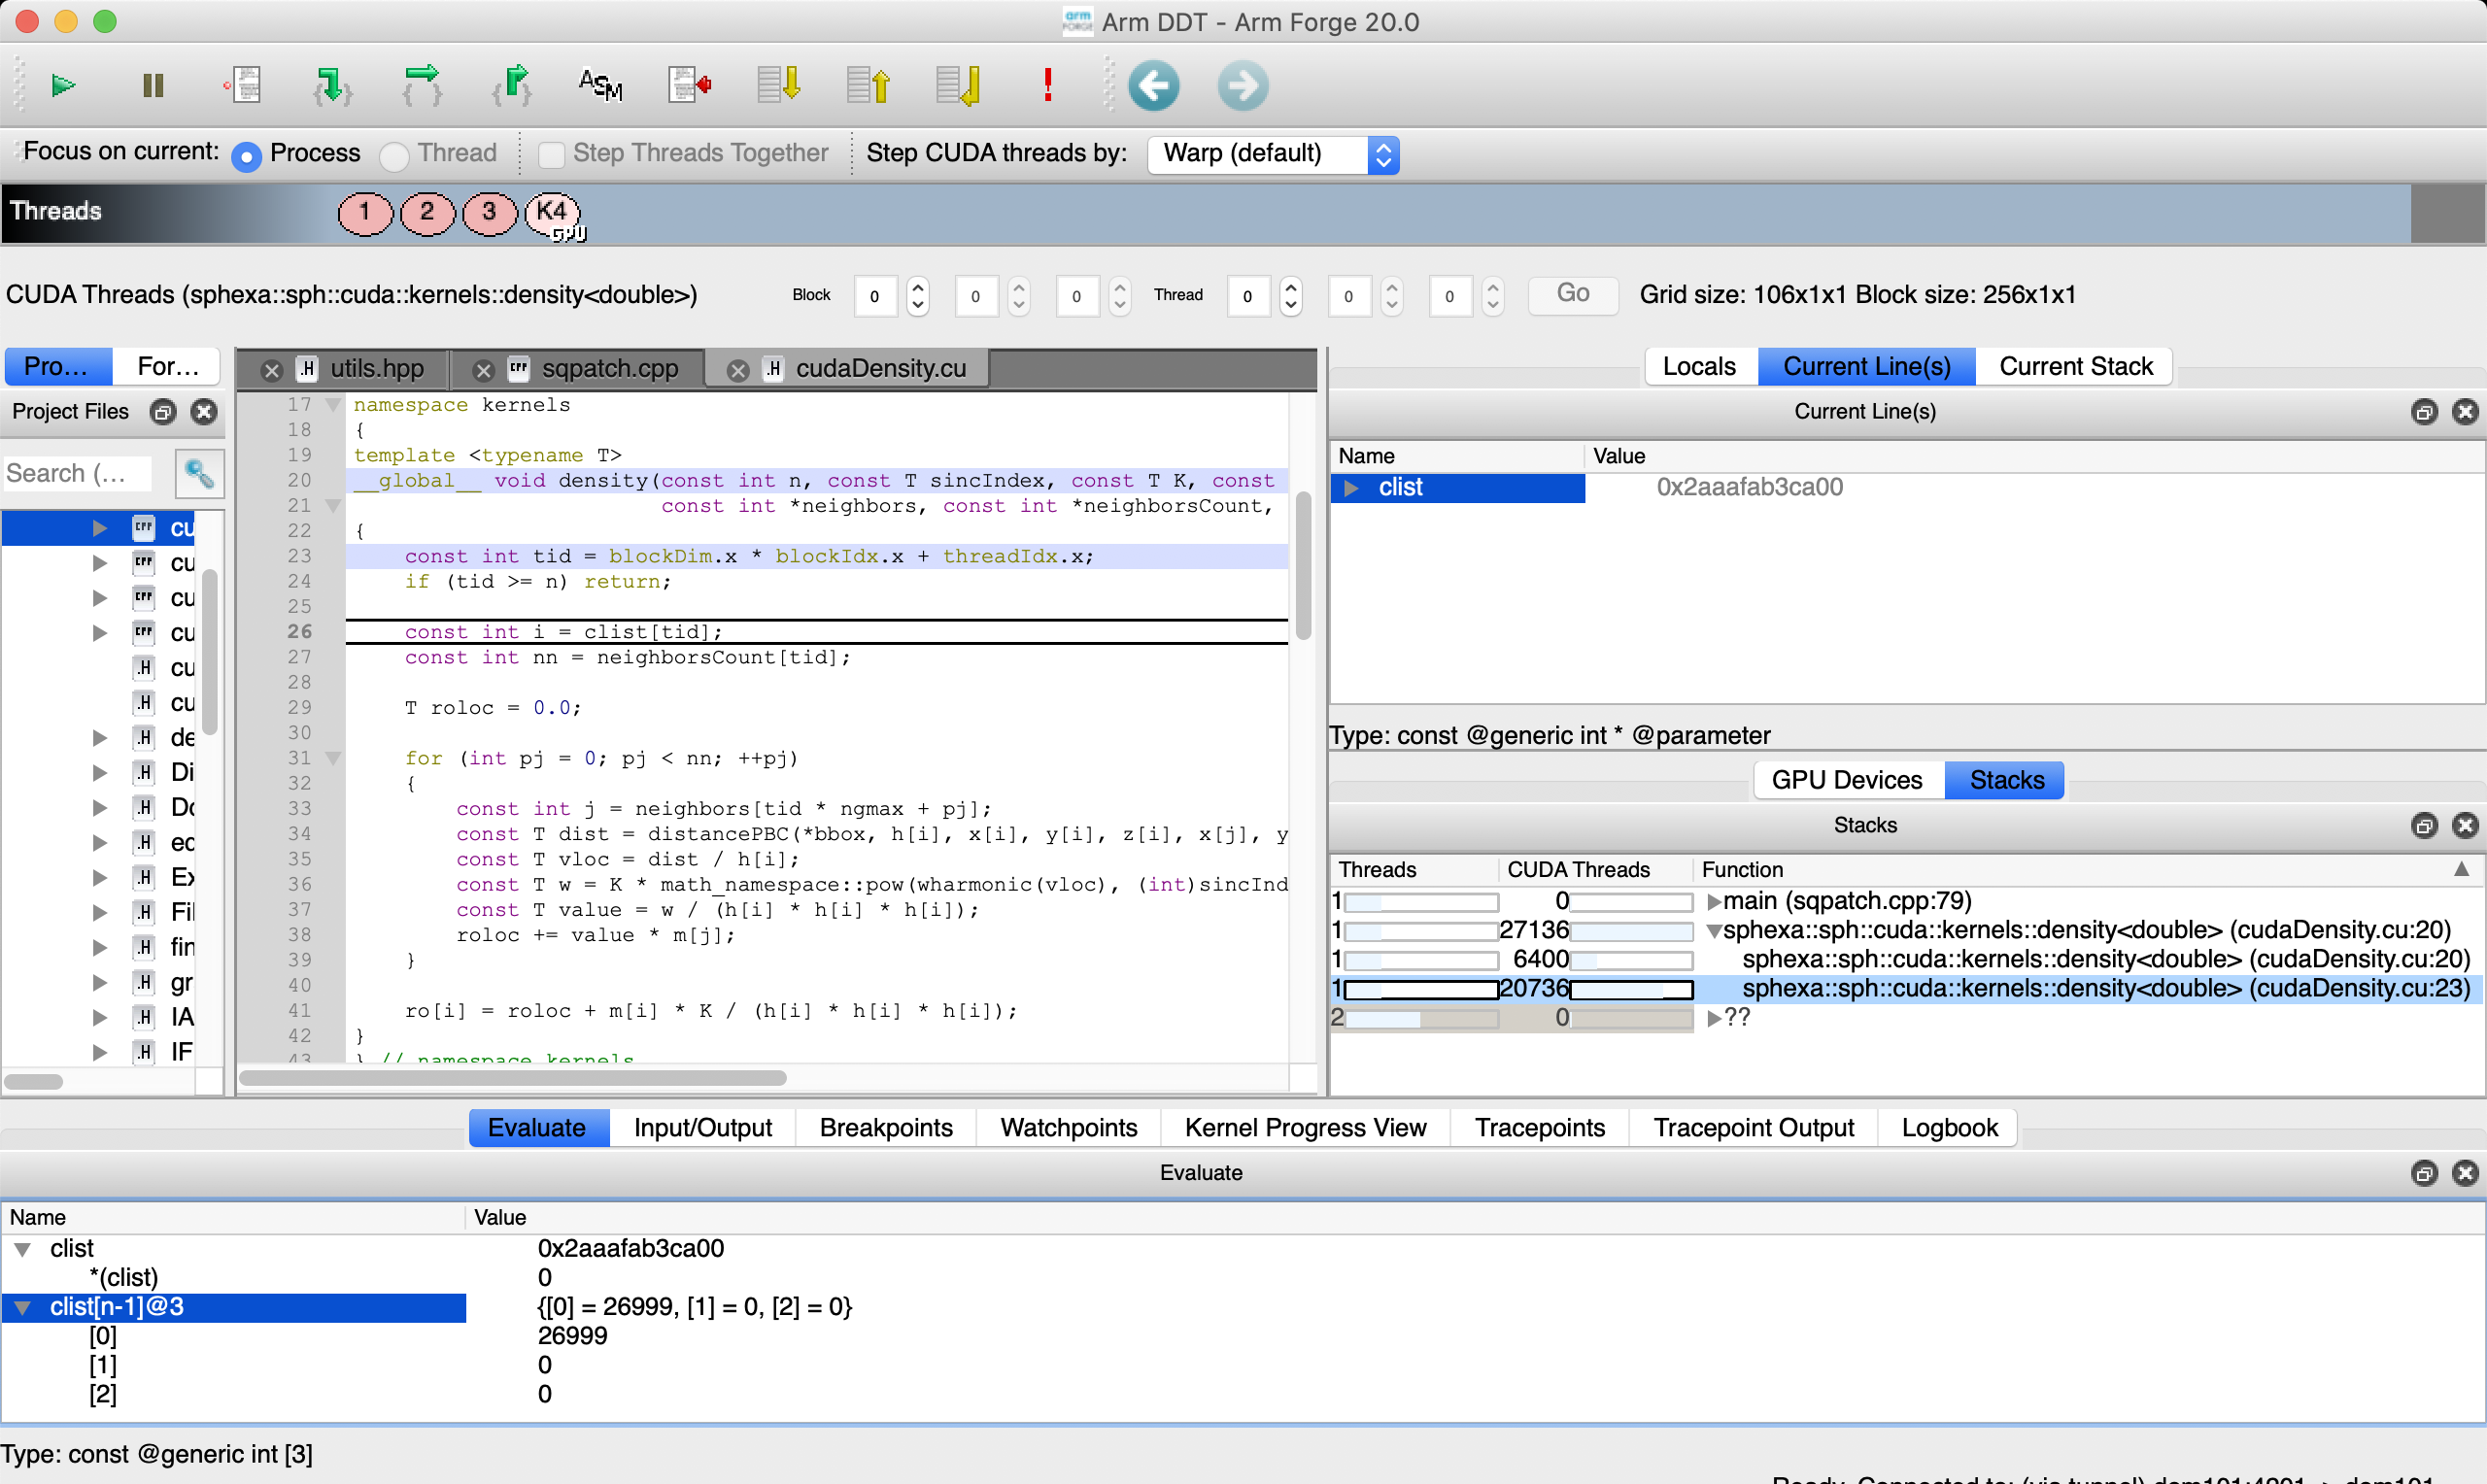
Arm Forge DDT variables (gpu)
Note
GPU execution under the control of a debugger is not as fast as running without a debugger.
Running ddt with a tracepoint allows to specify the variables to record at
runtime in batch mode. This is done in the set_launcher method.
An overview of the debugging data will typically look like this in the html
report:

Arm Forge DDT html report (tracepoints)
and similarly in the txt report:
Tracepoints

#   Time               Tracepoint              Processes                                      Values
           sphexa::sph::cuda::kernels::density
           <double>(int, double, double, int,
           sphexa::BBox<double> const*, int
1 0:17.610 const*, int const*, int const*,     0         clist[27000-1]@3: {[0] = 26999, [1] = 0, [2] = 0} clist: Sparkline
           double const*, double const*,                 0x2aaafab3ca00
           double const*, double const*,
           double const*, double*)
           (cudaDensity.cu:26)
           sphexa::sph::cuda::kernels::density