NVIDIA® tools
The NVIDIA Developer Tools are a collection of applications, spanning desktop and mobile targets, which enable developers to build, debug, profile, and develop class-leading and cutting-edge software that utilizes the latest visual computing hardware from NVIDIA.
The performance tools from the VI-HPS Institute are also supported on NVIDIA gpus.
Nsight™ Systems
NVIDIA® Nsight™ Systems is a system-wide performance analysis tool designed to visualize an application’s algorithms, help you identify the largest opportunities to optimize, and tune to scale efficiently across any quantity or size of CPUs and GPUs.
CUDA
Running the test
The test can be run from the command-line:
module load reframe
cd hpctools.git/reframechecks/nvidia

~/reframe.git/reframe.py \
-C ~/reframe.git/config/cscs.py \
--system daint:gpu \
--prefix=$SCRATCH -r \
-p PrgEnv-gnu \
--performance-report \
--keep-stage-files \
-c ./nsys_cuda.py
A successful ReFrame output will look like the following:
Reframe version: 2.22
Launched on host: daint101

[----------] started processing sphexa_nsyscuda_sqpatch_002mpi_001omp_100n_0steps (Tool validation)
[ RUN      ] sphexa_nsyscuda_sqpatch_002mpi_001omp_100n_0steps on daint:gpu using PrgEnv-gnu
[       OK ] sphexa_nsyscuda_sqpatch_002mpi_001omp_100n_0steps on daint:gpu using PrgEnv-gnu
[----------] all spawned checks have finished

[  PASSED  ] Ran 1 test case(s) from 1 check(s) (0 failure(s))
Looking into the Class shows how to
setup and run the code with the tool.
self.executable_opts sets a list of arguments to pass to the tool.
The report will be generated automatically at the end of the job.
Performance reporting
A typical output from the --performance-report flag will look like this:
This report is generated from the data collected from the tool and processed in
the self.perf_patterns part of the Class. For example, the information (%) about the
data transfers from host to device ([CUDA memcpy HtoD]) is extracted with
the nsys_report_HtoD_pct method.
Looking at the report with the tool gives more insight into the performance of
the code:
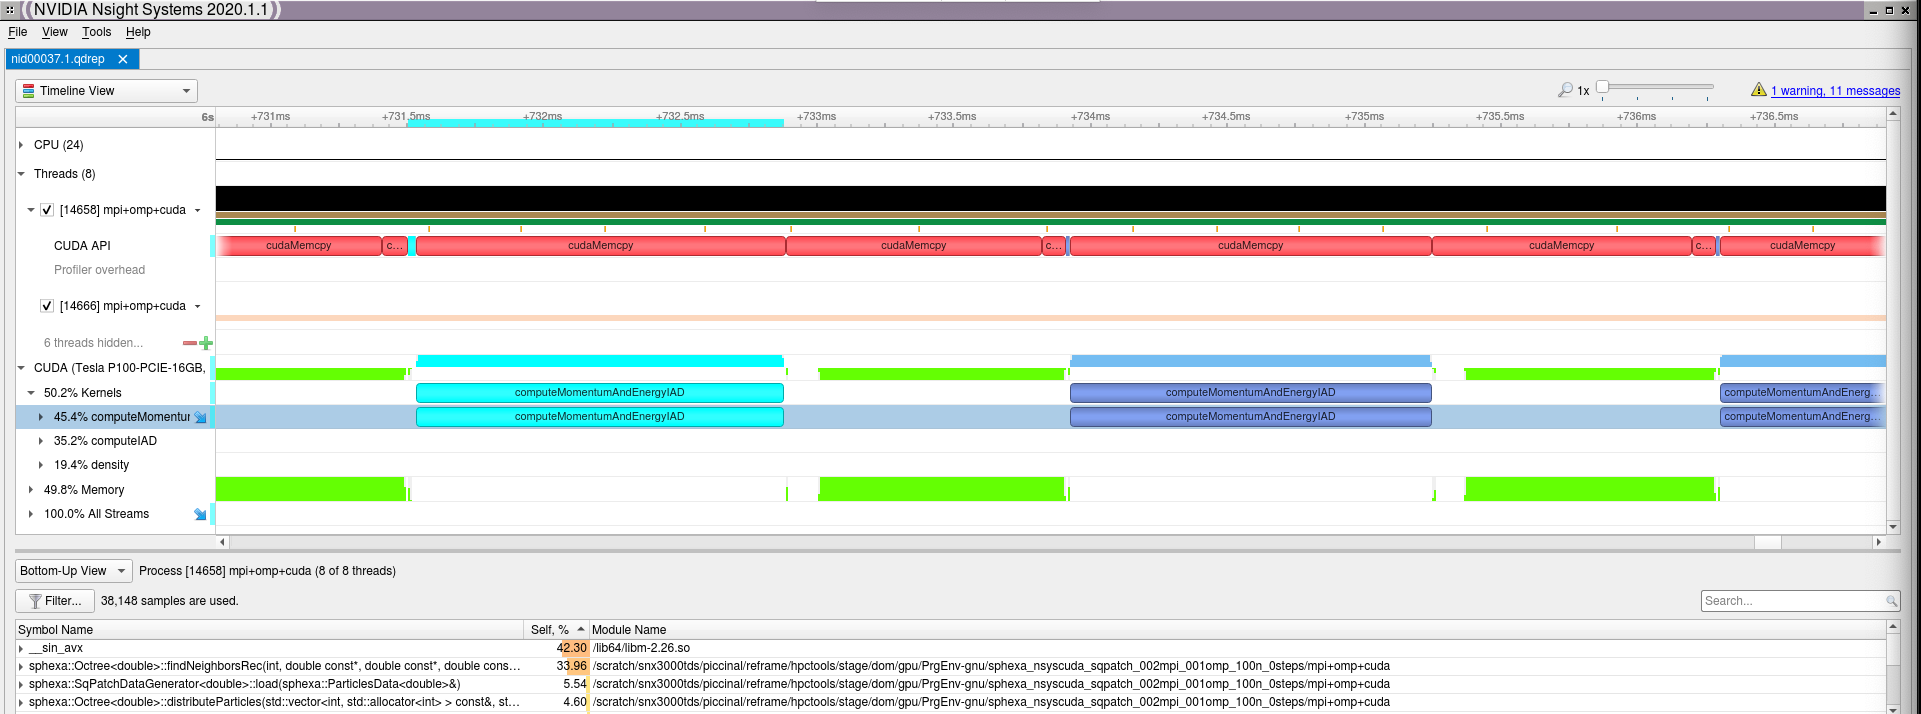
Nsight Cuda (launched with: nsight-sys nid00036.0.qdrep)
VI-HPS tools
OPENACC
Running the test
The test can be run from the command-line:
module load reframe
cd hpctools.git/reframechecks/openacc

~/reframe.git/reframe.py \
-C ~/reframe.git/config/cscs.py \
--system daint:gpu \
--prefix=$SCRATCH -r \
-p PrgEnv-pgi \
--performance-report \
--keep-stage-files \
-c ./scorep_openacc.py
A successful ReFrame output will look like the following:
Reframe version: 2.22
Launched on host: daint101

[----] waiting for spawned checks to finish
[ OK ] openacc_scorepT_sqpatch_001mpi_001omp_100n_1steps_0cycles_ru_maxrss,ru_utime on daint:gpu using PrgEnv-pgi
[ OK ] openacc_scorepT_sqpatch_002mpi_001omp_126n_1steps_0cycles_ru_maxrss,ru_utime on daint:gpu using PrgEnv-pgi
[ OK ] openacc_scorepT_sqpatch_004mpi_001omp_159n_1steps_0cycles_ru_maxrss,ru_utime on daint:gpu using PrgEnv-pgi
[ OK ] openacc_scorepT_sqpatch_008mpi_001omp_200n_1steps_0cycles_ru_maxrss,ru_utime on daint:gpu using PrgEnv-pgi
[ OK ] openacc_scorepT_sqpatch_016mpi_001omp_252n_1steps_0cycles_ru_maxrss,ru_utime on daint:gpu using PrgEnv-pgi
[----] all spawned checks have finished

[  PASSED  ] Ran 5 test case(s) from 1 check(s) (0 failure(s))
Looking into the Class shows
how to setup and run the code with the tool. This check is based on the
PrgEnv-pgi programming environment and the Score-P and
otf2_cli_profile performance tools. Set self.build_system.cxx to
instrument the code and set the SCOREP runtime variables with
self.variables to trigger the (OpenACC and rusage) tracing analysis.
A text report will be generated using the
otf_profiler
method at the end of the job.
Performance reporting
A typical output from the --performance-report flag will look like this:
openacc_scorepT_sqpatch_016mpi_001omp_252n_1steps_0cycles_ru_maxrss,ru_utime
   - PrgEnv-pgi
      * num_tasks: 16
      * Elapsed: 28.3313 s
      * _Elapsed: 51 s
      * domain_distribute: 4.1174 s
      * mpi_synchronizeHalos: 0.8513 s
      * BuildTree: 0 s
      * FindNeighbors: 14.6041 s
      * Density: 0.5958 s
      * EquationOfState: 0.0139 s
      * IAD: 0.2347 s
      * MomentumEnergyIAD: 0.3717 s
      * Timestep: 0.1205 s
      * UpdateQuantities: 0.3322 s
      * EnergyConservation: 0.0222 s
      * SmoothingLength: 0.0759 s
      * %MomentumEnergyIAD: 1.31 %
      * %Timestep: 0.43 %
      * %mpi_synchronizeHalos: 3.0 %
      * %FindNeighbors: 51.55 %
      * %IAD: 0.83 %
      * otf2_serial_time: 4155615
      * otf2_parallel_time: 118870912344
      * otf2_func_compiler_cnt: 176081961
      * otf2_func_compiler_time: 109542525102
      * otf2_func_mpi_cnt: 18112
      * otf2_func_mpi_time: 4931595527
      * otf2_func_openacc_cnt: 63504
      * otf2_func_openacc_time: 4400947330
      * otf2_messages_mpi_cnt: 17072
      * otf2_messages_mpi_size: 10356574336 Bytes
      * otf2_coll_mpi_cnt: 1664
      * otf2_coll_mpi_size: 1577926656 Bytes
      * otf2_rusage: 0 (deactivated)
This report is generated from the data collected from the tool and processed in
the self.perf_patterns part of the Class. For example, the total size (in Bytes)
of MPI communication the data transfers (otf2_messages_mpi_size) is
extracted with the otf2cli_perf_patterns
method.
Looking at the report with the tool gives more insight into the performance of the code:
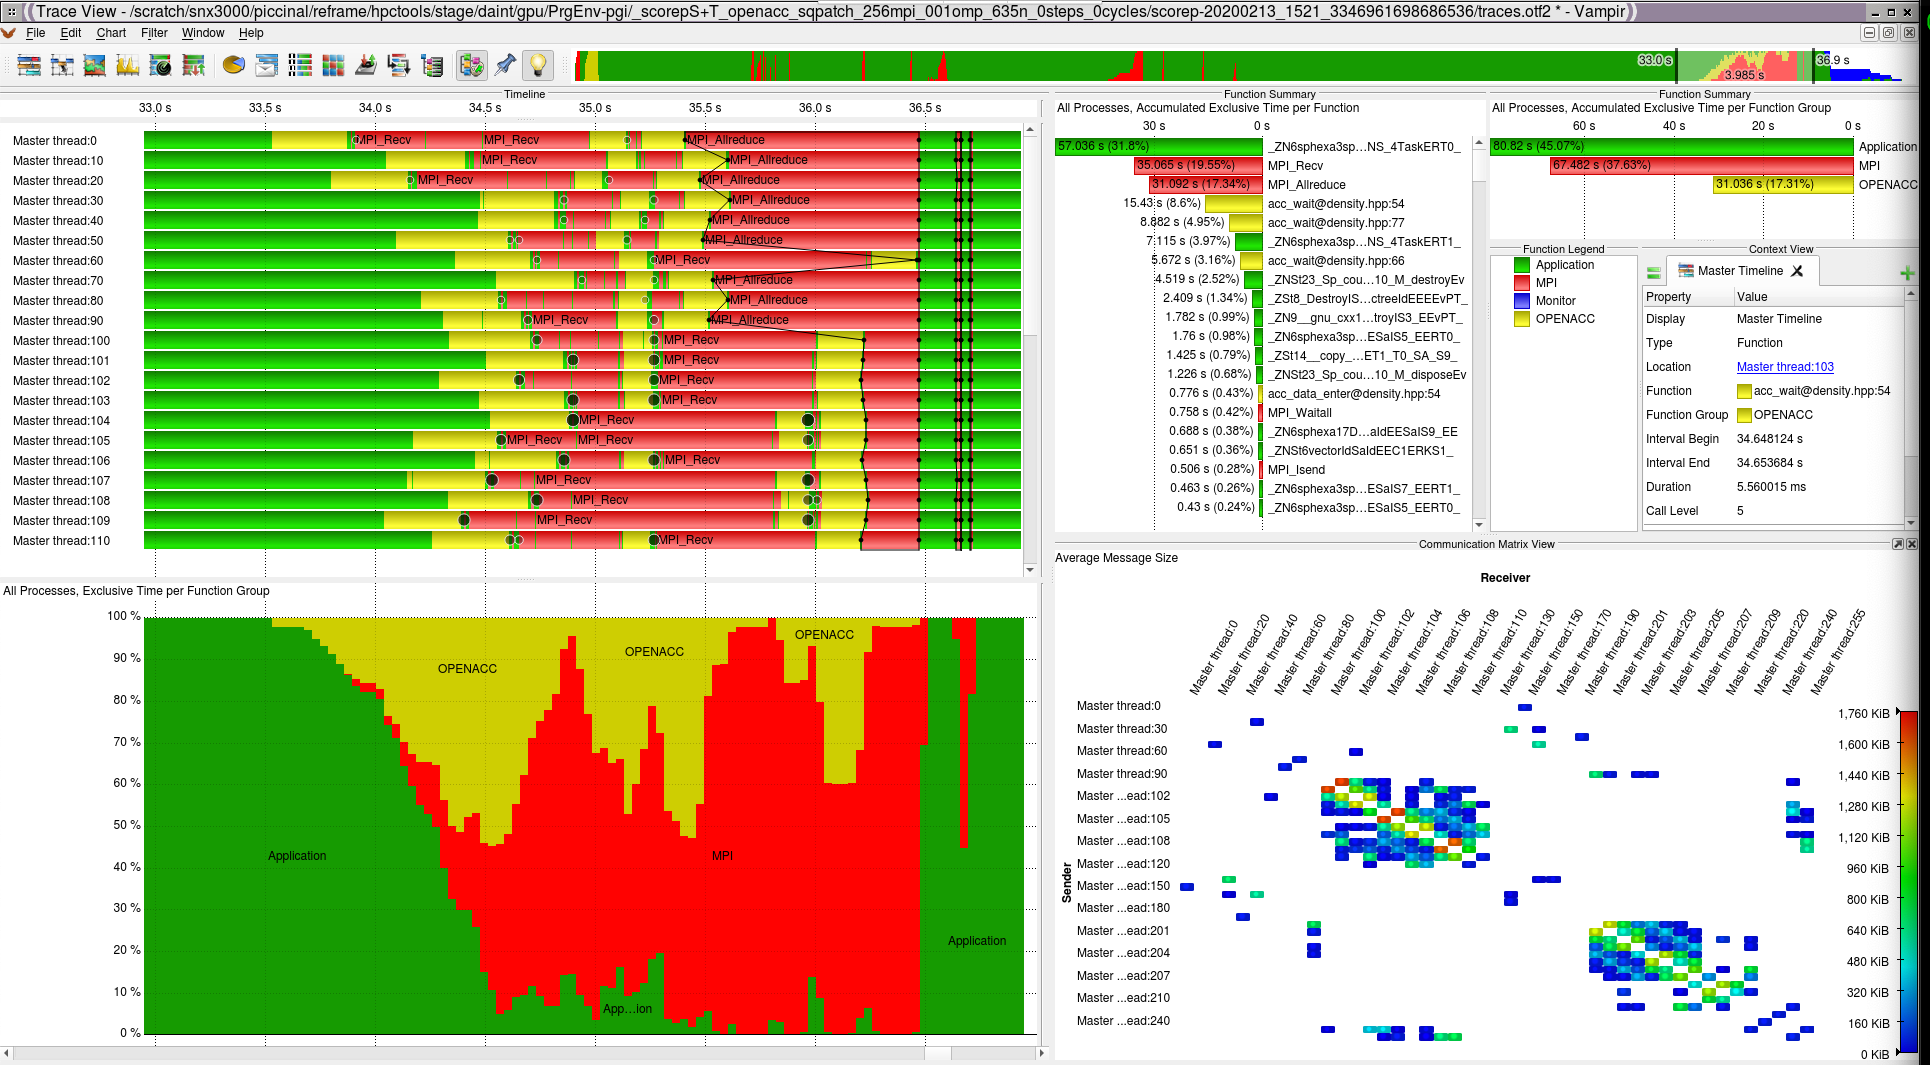
Score-P Vampir OpenACC (launched with: vampir scorep-/traces.otf2)